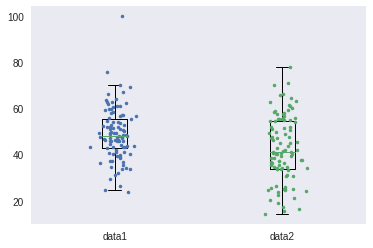
(完成形ではなく、そのうち拡張します)
matplotlibで箱ひげ図を描くことがあったのですが、要望として「どのように各点が散らばっているか、図示してほしい」と言われました。
seabornを利用すれ簡単にできそうですが、matplotlibだけで試しました。
import matplotlib.pyplot as plt
%matplotlib inline
import numpy as np
import pandas as pd

def show_boxplot(data, xvar, title="", ylabel=""):
    '''
    data:   taple data
    xvar:   array label data for each value name
    title:  string
    ylabel: string
    '''
    fig, ax = plt.subplots()
    bp = ax.boxplot(data)
    ax.set_xticklabels(xvar)
    ax.set_ylabel(ylabel)
    ax.set_title(title)

    for y, i in zip(data, range(len(xvar))):
        # "jitter" to the x-axis
        x = np.random.normal(i+1, 0.05, size=len(y))
        ax.plot(x, y, '.', color="C{}".format(i))

    ax.grid()
    plt.show()

data1 = np.random.normal(50, 10, 100)
data1 = np.append(data1, 100)             # 外れ値
data2 = np.random.normal(45, 15, 100)
xvar = ["data1", "data2"]
show_boxplot((data1, data2), xvar)
