目的
UdemyでのPythonの講義の復習を兼ねて、Titanic号沈没事故について調べてみました。
環境はWindows10,Python3.5.2
すべてjupyter notebookで書いたものです。
それではさっそくpandasをインポートするところから始めていきます。
import pandas as pd
from pandas import Series, DataFrame
まずはTitanic号沈没のデータを取得するためにKaggleにから当該データのあるサイト (https://www.kaggle.com/c/titanic) からtrain.csvファイルをダウンロードしましょう。
# csvファイルの読み込み
titanic_df = pd.read_csv('train.csv')
# ファイルの先頭部を表示し、データセットを確認する
titanic_df.head()
| PassengerId | Survived | Pclass | Name | Sex | Age | SibSp | Parch | Ticket | Fare | Cabin | Embarked | |
|---|---|---|---|---|---|---|---|---|---|---|---|---|
| 0 | 1 | 0 | 3 | Braund, Mr. Owen Harris | male | 22.0 | 1 | 0 | A/5 21171 | 7.2500 | NaN | S |
| 1 | 2 | 1 | 1 | Cumings, Mrs. John Bradley (Florence Briggs Th... | female | 38.0 | 1 | 0 | PC 17599 | 71.2833 | C85 | C |
| 2 | 3 | 1 | 3 | Heikkinen, Miss. Laina | female | 26.0 | 0 | 0 | STON/O2. 3101282 | 7.9250 | NaN | S |
| 3 | 4 | 1 | 1 | Futrelle, Mrs. Jacques Heath (Lily May Peel) | female | 35.0 | 1 | 0 | 113803 | 53.1000 | C123 | S |
| 4 | 5 | 0 | 3 | Allen, Mr. William Henry | male | 35.0 | 0 | 0 | 373450 | 8.0500 | NaN | S |
以下、今回の解析で重要なものについて。
- Survived ... 1 -> 生存者(Alive), 0 ->死者(Dead)
- Pclass ... 1,2,3の順に高級クラスの客室
- Sex,Age ... それぞれ性別と年齢
- SibSp ... 兄弟および配偶者の数
- Parch ... 親もしくは子供の数
- Fare ... 運賃
- Embarked ... 乗船した港(3つ)
乗客について
## numpyとseabornをインポート
import numpy as np
import matplotlib.pyplot as plt
import seaborn as sns
%matplotlib inline

# データには年齢の欄はあるが子供かどうかの欄はない
# ここでは10歳未満を子供とする

def male_female_child(passenger):
    age, sex = passenger
    if age < 10:
        return 'child'
    else:
        return sex

# 男女と子供にわけたpersonという新しい列を追加
titanic_df['person'] = titanic_df[['Age','Sex']].apply(male_female_child, axis=1)

# 乗客数(生存者含む)をカウントする
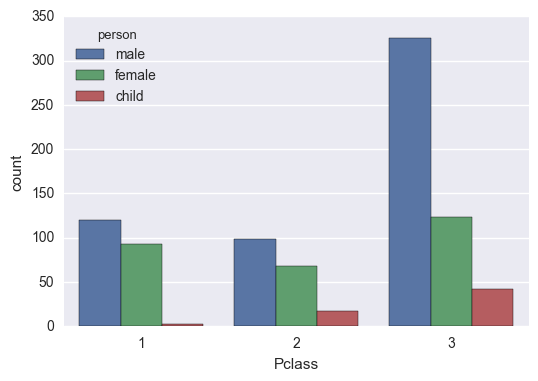
sns.countplot('Pclass', data=titanic_df, hue='person')
三等客室を一等客室を比べると子供の数が圧倒的に多いです。
ここで年齢の分布を見てみましょう。
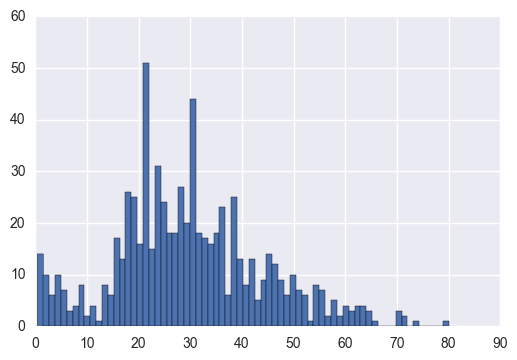
titanic_df['Age'].hist(bins=70)
titanic_df['Age'].mean()
29.69911764705882
全体の平均年齢はおよそ30歳だったようです。
今度はFacetGridを使って客室クラスごとの年齢層を見てみましょう。
fig = sns.FacetGrid(titanic_df, hue='Pclass', aspect=4)
fig.map(sns.kdeplot, 'Age', shade=True)
oldest = titanic_df['Age'].max()
fig.set(xlim=(0,oldest))
fig.add_legend()
おおよその乗客の様子がわかってきました。
港について
ところでEmbarked(Embark...乗船する)の列には「C」「Q」「S」3つの値が入っています。
これはKaggleのページを見るにそれぞれCherbourg港, Queenstown港, Southhampton港を意味しています。
どれも知らない土地なのでその港から乗船した人たちの客室クラスから推理してみます。
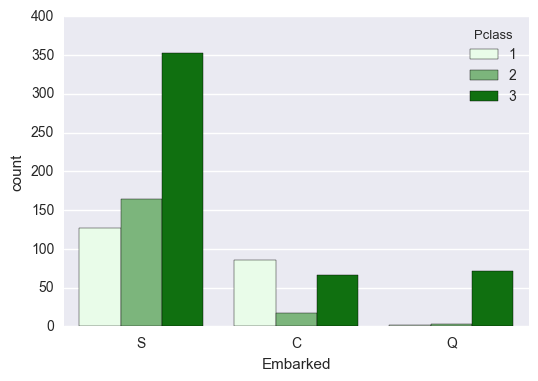
sns.countplot('Embarked', data=titanic_df, hue='Pclass', color ='g')
どうやらSouthhampton港がこの中では一番大きい港のようです。
また、Cherbourg港,のほうがQueenstown港よりは経済の豊かな土地であったことが推測されます。
乗船費用について
# FacetGridを使って客室クラス別の乗船費用の分布をみる
fig = sns.FacetGrid(titanic_df, hue='Pclass', aspect=3)
fig.map(sns.kdeplot, 'Fare', shade=True)
highest = titanic_df['Fare'].max()
fig.set(xlim=(0,highest))
fig.add_legend()
頭の悪そうなグラフができました。
titanic_df['Fare'].max()
512.32920000000001
titanic_df['Fare'].mean()
32.2042079685746
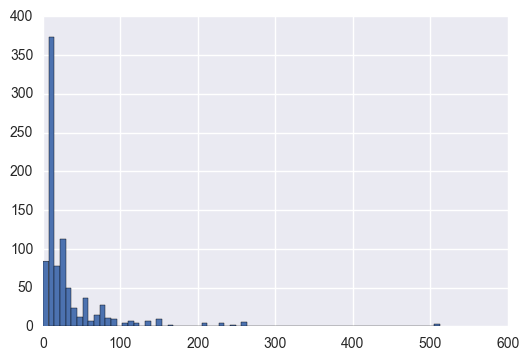
あきらかにすごいお金を払っている人たちがいますね…。
titanic_df[titanic_df['Fare']>300]
| PassengerId | Survived | Pclass | Name | Sex | Age | SibSp | Parch | Ticket | Fare | Cabin | Embarked | person | |
|---|---|---|---|---|---|---|---|---|---|---|---|---|---|
| 258 | 259 | 1 | 1 | Ward, Miss. Anna | female | 35.0 | 0 | 0 | PC 17755 | 512.3292 | NaN | C | female |
| 679 | 680 | 1 | 1 | Cardeza, Mr. Thomas Drake Martinez | male | 36.0 | 0 | 1 | PC 17755 | 512.3292 | B51 B53 B55 | C | male |
| 737 | 738 | 1 | 1 | Lesurer, Mr. Gustave J | male | 35.0 | 0 | 0 | PC 17755 | 512.3292 | B101 | C | male |
この3人がほかの乗客と比べてもとびぬけて高い乗船費用を払っていたようです。(そして当然のことながら全員事故から生還しています。)
気になる方のために上記3名についてのサイトリンクを載せておきます。
この3人だけ抜いたグラフを描いてみます。
drop_idx = [258, 679, 737]
titanic_df2 = titanic_df.drop(drop_idx)

fig = sns.FacetGrid(titanic_df2, hue='Pclass', aspect=4)
fig.map(sns.kdeplot, 'Fare', shade=True)
highest = titanic_df2['Fare'].max()
fig.set(xlim=(0,highest))
fig.add_legend()
あまり見やすくはなりませんでした…
一応乗船費用のヒストグラムを見てみます。
titanic_df['Fare'].hist(bins=70)
生存率について
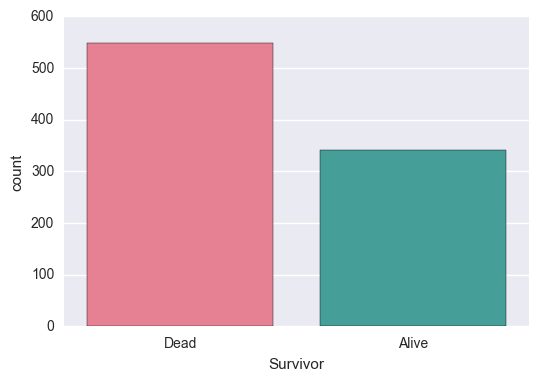
まずは、全体の生存率についてざっくりと。
titanic_df['Survivor'] = titanic_df.Survived.map({0:'Dead', 1:'Alive'})
sns.countplot('Survivor', data=titanic_df, palette='husl')
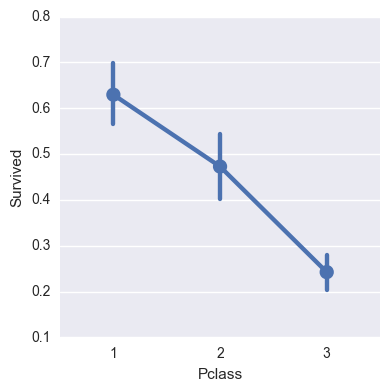
次に、客室クラスと生存率について。
sns.factorplot('Pclass', 'Survived', data=titanic_df)
ここまでは順当な結果に思われます。
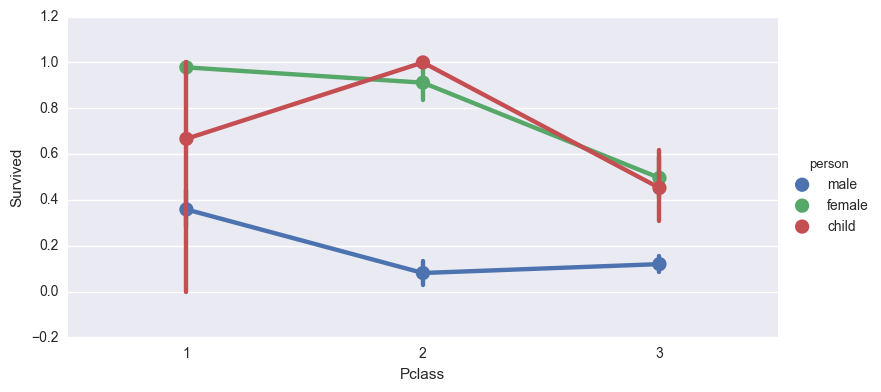
hueを使ってさらに細かく見てみます。
sns.factorplot('Pclass', 'Survived', hue='person', data=titanic_df, aspect=2)
一瞬「?」となりましたが、上で調べたようにそもそも一等室にはほとんど子供がいませんでした。
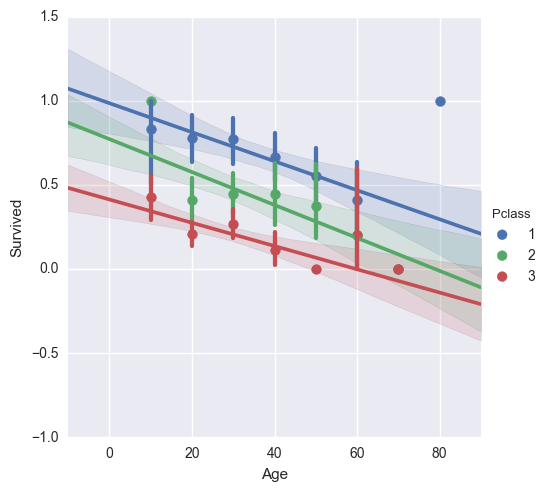
年齢ごとの生存率グラフに回帰線を引いてみます。
generations = [10,20,30,40,50,60,70,80]
sns.lmplot('Age', 'Survived', hue='Pclass', data=titanic_df,
           hue_order=[1,2,3], x_bins=generations)
ばらつきこそあれ、年齢問わず客室のランクによって10~20%生存率に差があるのがわかります。
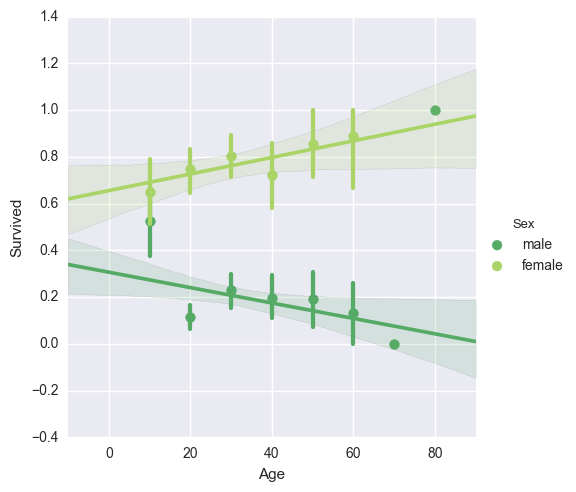
sns.lmplot('Age','Survived',hue='Sex',data=titanic_df,palette='summer',
           x_bins=generations)
ただし、性別で比較すると女性は年齢が上がるごとに生存率が上がっていることがわかりました。
感想
jupyter notebookまだ慣れないけど、とりあえず今回いろいろ書いて esc + 'M' のショートカットでMarkdownに変えられることが分かったのが収穫です。


