Apply patch to fix submit error
$ cd ex3
$ patch -p1 < ../diff.patch
diff.patch は、
git diff 958e1^ 958e1 --no-prefix > diff.patch
として作成。
Octave
~ をダミー引数として使える
max(m, [], 2) は、各行の max をとった列ベクトルを返す。第二引数を指定した場合、そこに argmax を返す。
>> [~, i] = max(magic(3), [], 2)
i =

   1
   3
   2
find(y==0) : y(i) == 0 となるインデックスのリスト
v(2:length(v)) のかわりに v(2:end) とかける
Linear regression example
Data set:
| feature foo | bar | result |
|---|---|---|
| 1 | 2 | 5 |
| 2 | 3 | 4 |
data = [1 2; 1 3];
y = [5; 4];
m = length(y); % #data
n = length(data(1,:)); % #feature

X  = [ones(m,1) data];
% 1 1 2
% 1 2 3
x = X(1,:)
% 1 1 2
Gradient descent
hypothesis: $ h_{\theta}(x) = x'\theta $.
cost function: $$ J(\theta) = \frac{1}{2m} \sum_{i=1}^m \left(h_{\theta}(X^{(i)}) - y^{(i)}\right)^2 = \frac{1}{2m}(X\theta - y)^2$$
function J = costFunction(X, y, theta)
  J = sum((X * theta - y) .^ 2) / (2 * length(y))
end
学習率 learning rate: $\alpha$.
\theta_j := \theta_j - \alpha\frac{\partial}{\partial \theta_j}J(\theta)
= \theta_j - \alpha\frac{1}{m}\sum_{i=1}^m X^{(i)}_j  \left(h_{\theta}(X^{(i)}) - y^{(i)}\right) =  \theta_j - \frac{\alpha}{m}X'_j(X\theta - y)
or $$\theta := \theta - \frac{\alpha}{m}X'(X\theta - y)$$
theta = theta - alpha / m * X' * (X * theta - y)
Plot:
history = zeros(num_iter, 1);
for iter = 1:num_iter
  history(iter) = costFunction(theta)
  theta = theta - alpha / m * X' * (X * theta - y)
end
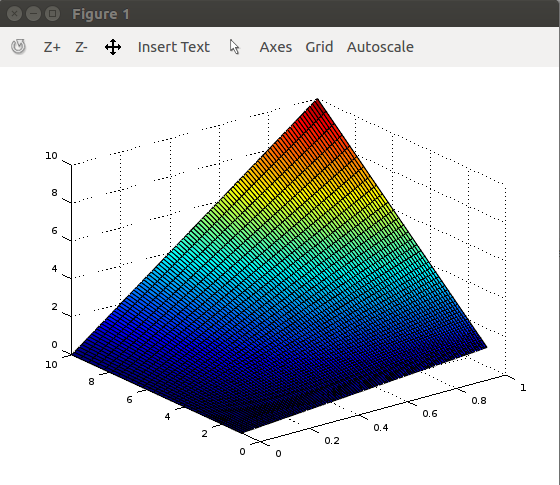
Visualization
theta0s = linspace(0,1)  % 0~1 を等間隔に100個. = linspace(0,1,100). logspace というのも.
theta1s = linspace(0,1)
data = zeros(len(theta0s), len(theta1s))
for i = 1:length(theta0s)
  for j = 1:length(theta1s)
    data(i,j) = f(theta0s(i); theta1s(j));
  end
end
% Bad knowhow for surf
data = data'
figure;
surf(theta0s, theta1s, data)
xlabel('\theta_0'); ylabel('\theta_1');

% TODO: contour.
Libraries
Visualization
x=linspace(0,1); % 1 x 100
y=logspace(0,1); % 1 x 50
data=x' * y;  % 100 x 50
surf(x,y,data'); % data' is a bad know-how for surf.
タイトル、軸ラベル、凡例のグラフへの追加
plot(x(1:50),y,'rx','MarkerSize', 5) % rx: use *red* *x* mark.

plot(y,'g--') % x = [1, 2, ...] if omitted. 'g--' means blacK dash line.

重ねて書く
plot(1:50, J1(1:50), ‘b’);
hold on;
plot(1:50, J2(1:50), ‘r’);
plot(1:50, J3(1:50), ‘k’);