はじめに
色々な種類のログをElasticSearchに貯める場合に、indexを分けるのか、同一indexでtypeを分けるのか、という点について、stackoverflowの記事に以下のようにありました。
- 個々のログのサイズが大きいのならindexを分けることで、検索を効率よく実行できる
- そうでないならtypeを分けると、沢山のindexを持つ際のストレージ容量のオーバーヘッドを避ける事ができる
indexを分けると、同じようなダッシュボードで対象indexを変えたものを沢山作りたくなります。その方法を考えてみました。
ここでは、題材としてHadoop daemonのログを利用しており、NameNode, DataNodeと言ったdaemonごとにindexを分けるケースを想定しています。(ちなみに、ログ自体はfluent-plugin-elasticsearchで格納しており、fluent-plugin-forestと組み合わせてlogstash_prefixをtagにしています)
ダッシュボードの保存型式
Kibana3のダッシュボードは、以下のいずれかに保存することができます。
- ブラウザ内(Local storage?)
- ファイル
- ElasticSearch
ElasticSearchに保存すると、ダッシュボードを一覧から選択したり検索したりできるので便利です。
ダッシュボードのテンプレートを作る
まず、どれかのindexに対して見たいダッシュボードを作成し、"save"ボタンの"Export to file"でJSONファイルを保存します。JSONは以下の様な形をしています。
{
  "title": "hadoop-namenode",
  "services": {
    "query": {
      "idQueue": [
        3,
        4
      ],
      "list": {
        "0": {
          "query": "INFO",
          "alias": "",
          "color": "#7EB26D",
          "id": 0,
          "pin": false,
          "type": "lucene"
        },
        "1": {
          "id": 1,
          "color": "#EAB839",
          "query": "WARN",
          "alias": "",
          "pin": false,
          "type": "lucene"
        },
        "2": {
          "id": 2,
          "color": "#6ED0E0",
          "query": "ERROR",
          "alias": "",
          "pin": false,
          "type": "lucene"
        }
      },
(snip)
  "editable": true,
  "index": {
    "interval": "day",
    "pattern": "[txtlog.hadoop.daemonlog.namenode-]YYYY.MM.DD",
    "default": "_all"
  },
  "style": "dark",
  "failover": false,
  "panel_hints": true,
  "loader": {
    "save_gist": false,
    "save_elasticsearch": true,
    "save_local": true,
    "save_default": true,
    "save_temp": true,
    "save_temp_ttl_enable": true,
    "save_temp_ttl": "30d",
    "load_gist": true,
    "load_elasticsearch": true,
    "load_elasticsearch_size": 20,
    "load_local": true,
    "hide": false
  }
}
これをテンプレートとしてtitleとindex.patternを変えたJSONを作成し、それぞれをElasticSearchに登録します.
ElasticSearchへの保存型式
ダッシュボードをElasticSearchに保存した場合、kibana-intというindexに格納されます。格納されたものはREST APIを利用して参照可能です。
curl -XGET 'http://10.29.254.31:9200/kibana-int/_search?q=*' | ruby -r json -e 'puts JSON.pretty_generate(JSON.parse(STDIN.read))'
格納されたものを見ると以下のようになっており、dashboardというフィールドに先ほどのJSONを文字列として入れておけば良さそうです。
     {
        "_index": "kibana-int",
        "_type": "dashboard",
        "_id": "hadoop-namenode",
        "_score": 1.0,
        "_source": {
          "user": "guest",
          "group": "guest",
          "title": "hadoop-namenode",
          "dashboard": "{\"title\":\"hadoop-namenode\",\"services\":{\"query\":{\"idQueue\":[3,4],\"list\":{\"0\":{\"query\":\"INFO\",\"alias\":\"\",\"color\":\"#7EB26D\",\"id\":0,\"pin\":false,\"type\":\"lucene\"},\"1\":{\"id\":1,\"color\":\"#EAB839\",\"query\":\"WARN\",\"alias\":\"\",\"pin\":false,\"type\":\"lucene\"},\"2\":{\"id\":2,\"color\":\"#6ED0E0\",\"query\":\"ERROR\",\"alias\":\"\",\"pin\":false,\"type\":\"lucene\"}},\"ids\":[0,1,2]},\"filter\":{\"idQueue\":[1,2],\"list\":{\"0\":{\"from\":\"2013-10-05T07:59:43.832Z\",\"to\":\"2013-10-07T07:59:43.832Z\",\"field\":\"@timestamp\",\"type\":\"time\",\"mandate\":\"must\",\"active\":true,\"alias\":\"\",\"id\":0}},\"ids\":[0]}},\"rows\":[{\"title\":\"Options\",\"height\":\"50px\",\"editable\":true,\"collapse\":false,\"collapsable\":true,\"panels\":[{\"error\":\"\",\"span\":8,\"editable\":true,\"type\":\"timepicker\",\"loadingEditor\":false,\"status\":\"Stable\",\"mode\":\"relative\",\"time_options\":[\"5m\",\"15m\",\"1h\",\"6h\",\"12h\",\"24h\",\"2d\",\"7d\",\"30d\"],\"timespan\":\"2d\",\"timefield\":\"@timestamp\",\"timeformat\":\"\",\"refresh\":{\"enable\":false,\"interval\":30,\"min\":3},\"filter_id\":0,\"title\":\"Timepicker\"}]},{\"title\":\"Query\",\"height\":\"50px\",\"editable\":true,\"collapse\":false,\"collapsable\":true,\"panels\":[{\"error\":false,\"span\":12,\"editable\":true,\"group\":[\"default\"],\"type\":\"query\",\"label\":\"Search\",\"history\":[\"ERROR\",\"WARN\",\"INFO\",\"*\"],\"remember\":10,\"pinned\":true,\"query\":\"*\",\"title\":\"Search\"}]},{\"title\":\"Histogram\",\"height\":\"150px\",\"editable\":true,\"collapse\":false,\"collapsable\":true,\"panels\":[{\"span\":8,\"editable\":true,\"type\":\"histogram\",\"loadingEditor\":false,\"mode\":\"count\",\"time_field\":\"@timestamp\",\"queries\":{\"mode\":\"all\",\"ids\":[0,1,2]},\"value_field\":null,\"auto_int\":true,\"resolution\":100,\"interval\":\"30m\",\"intervals\":[\"auto\",\"1s\",\"1m\",\"5m\",\"10m\",\"30m\",\"1h\",\"3h\",\"12h\",\"1d\",\"1w\",\"1M\",\"1y\"],\"fill\":0,\"linewidth\":3,\"timezone\":\"browser\",\"spyable\":true,\"zoomlinks\":true,\"bars\":true,\"stack\":true,\"points\":false,\"lines\":false,\"legend\":true,\"x-axis\":true,\"y-axis\":true,\"percentage\":false,\"interactive\":true,\"options\":true,\"tooltip\":{\"value_type\":\"cumulative\",\"query_as_alias\":false}},{\"span\":4,\"editable\":true,\"type\":\"hits\",\"loadingEditor\":false,\"queries\":{\"mode\":\"all\",\"ids\":[0,1,2]},\"style\":{\"font-size\":\"10pt\"},\"arrangement\":\"horizontal\",\"chart\":\"bar\",\"counter_pos\":\"above\",\"donut\":false,\"tilt\":false,\"labels\":true,\"spyable\":true,\"title\":\"Hits\"}]},{\"title\":\"Table\",\"height\":\"650px\",\"editable\":true,\"collapse\":false,\"collapsable\":true,\"panels\":[{\"error\":false,\"span\":12,\"editable\":true,\"type\":\"table\",\"loadingEditor\":false,\"status\":\"Stable\",\"queries\":{\"mode\":\"all\",\"ids\":[0,1,2]},\"size\":100,\"pages\":5,\"offset\":0,\"sort\":[\"@timestamp\",\"desc\"],\"group\":\"default\",\"style\":{\"font-size\":\"9pt\"},\"overflow\":\"min-height\",\"fields\":[null,\"@timestamp\",\"host\",\"message\"],\"highlight\":[],\"sortable\":true,\"header\":true,\"paging\":true,\"field_list\":true,\"trimFactor\":300,\"normTimes\":true,\"spyable\":true,\"title\":\"Table\"}]}],\"editable\":true,\"index\":{\"interval\":\"day\",\"pattern\":\"[txtlog.hadoop.daemonlog.namenode-]YYYY.MM.DD\",\"default\":\"_all\"},\"style\":\"dark\",\"failover\":false,\"panel_hints\":true,\"loader\":{\"save_gist\":false,\"save_elasticsearch\":true,\"save_local\":true,\"save_default\":true,\"save_temp\":true,\"save_temp_ttl_enable\":true,\"save_temp_ttl\":\"30d\",\"load_gist\":true,\"load_elasticsearch\":true,\"load_elasticsearch_size\":20,\"load_local\":true,\"hide\":false}}"
        }
      },
まとめて作る
ということで、あとはElasticSearch内に存在する各ログのindexと、テンプレートを利用してダッシュボードをスクリプトで量産します。スクリプト内のTEMPLATE_FILEには先ほどファイルに出力したJSONの場所を、INDEX_GLOBにはElasticSearchのindexファイルをワイルドカード型式で指定します。このglobにマッチするindexに対してそれぞれダッシュボードを生成してElasticSearchに保存します。
# !/usr/bin/env ruby

require 'json'
require 'net/http'

TEMPLATE_FILE='/var/www/html/kibana-latest/app/dashboards/hadoop_daemonlog_template.json'
INDEX_GLOB="/var/lib/elasticsearch/elasticsearch/nodes/*/indices/txtlog.hadoop.daemonlog.*"
ES_HOST="192.168.1.1"

template_json = JSON.parse(File.read(TEMPLATE_FILE))
indices=Dir.glob("#{INDEX_GLOB}-#{Time.now.strftime("%Y.%m.%d")}").each{|index|
  index_name = File.basename(index).gsub(/-\d{4}\.\d{2}\.\d{2}$/,"")
  template_json['title'] = index_name
  template_json['index']['pattern'] = "[#{index_name}-]YYYY.MM.DD"
  api = Net::HTTP.new(ES_HOST,9200)
  doc = {"user"=>"guest","group"=>"guest","title"=>index_name, "dashboard" => template_json.to_json}
  puts doc
  res = api.put("/kibana-int/dashboard/#{index_name}",doc.to_json)
  puts res
}
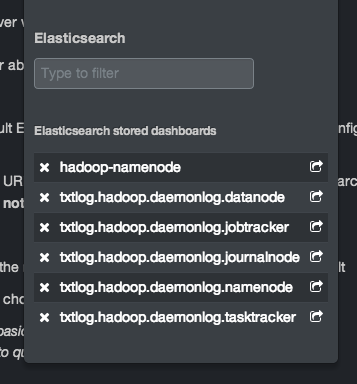
できあがり
Kibana3のLoadアイコンをクリックすると、登録したダッシュボードを一覧で見ることができます。検索もできるので、作りまくっても大丈夫そうです。