本記事はMicroAd Advent Calendar 2019の14日目の記事です。
はじめに
データの傾向を複数の観点から可視化するうえで、ヒートマップって便利ですよね。
matplotlibにもデータを流し込んだら、よしなにヒートマップを生成してくれるpcolorメソッドがあります。これはこれで、パパッと可視化したい時には便利なのですが、データの集計から可視化までがセットになってしまっているので、3軸目(色)に頻度以外の値や、自ら集計した値を利用したいという場合には利用できません。
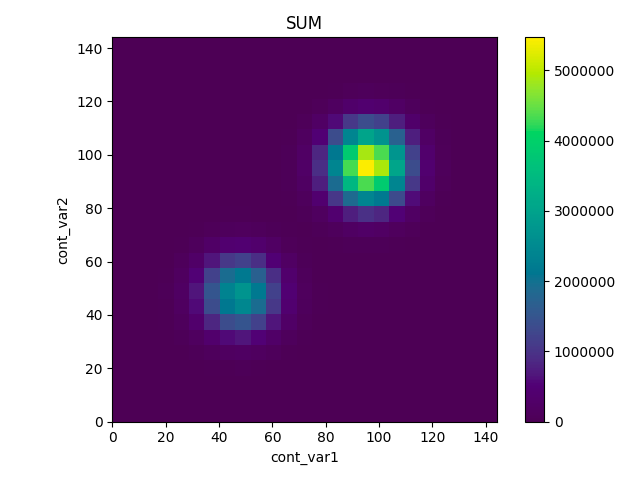
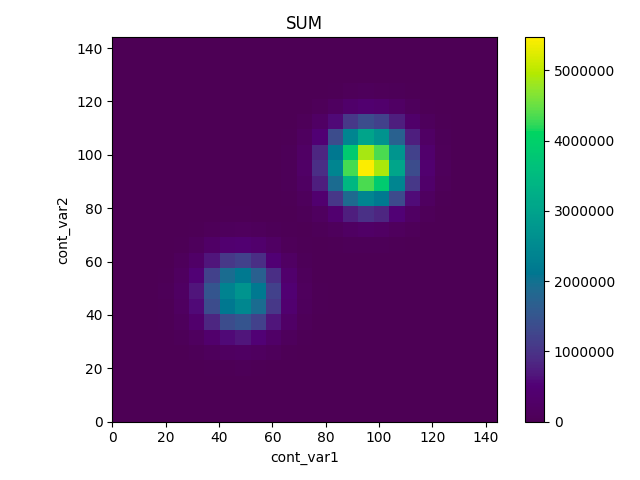
こんな時、matplotlibのimshowを利用すると、下記のような3軸目(色)をカスタムしたヒートマップがかけてちょっと便利です。(下記はレンジごとの頻度ではなく、和を3軸目(色)にとった例です。)
実装
ここでは3つの連続変数のうち2つの連続変数をビンで区切り、各ビンごとに残った連続変数の統計量をヒートマップで表現する例を示します。
下記順序で説明します。
- データセットの生成
- データセットのビン切り
- ヒートマップの生成
1.データセットの生成
まず、3連続変数のデータセットを正規分布からサンプリングして作ります。単峰分布だと可視化した時に映えなそうだったので、2峰分布にしてみました。2峰分布の母数はそれぞれ(平均、標準偏差)=(50, 10),(100, 10)とし、サンプル数を200,000件としています。
import pandas as pd
import numpy as np

def create_2peak_distribution(mean1, std1, mean2, std2, size):
    dist_1 = np.random.normal(mean1, std1, size)
    dist_2 = np.random.normal(mean2, std2, size)
    dist = np.concatenate([dist_1, dist_2]).reshape(size * 2, 1)
    return dist

# 母数などの設定値
mean1 = 50
mean2 = 100
std1 = 10
std2 = 10
size = 100000

# 各連続変数のデータ生成
cont_var1 = create_2peak_distribution(mean1, std1, mean2, std2, size)
cont_var2 = create_2peak_distribution(mean1, std1, mean2, std2, size)
cont_var3 = create_2peak_distribution(mean1, std1, mean2, std2, size)
# 連続変数を1つのデータフレームにまとめる
arr = np.concatenate([cont_var1, cont_var2, cont_var3], axis=1)
df = pd.DataFrame(dat, columns=['cont_var1', 'cont_var2', 'cont_var3'], dtype=int)
2.データセットのビン切りとデータの集計
次に、1で生成したデータセットのうち2つの連続変数をビンに分割し、データを各ビンの粒度で集計します。今回の集計は凝ったことはせずに、和をとるだけにしていますが、いろいろできるはずです。興味のある方はぜひ試してみてください。
なお、ビンの数はスタージェスの公式で算出した値を参考にしています。
import math

def get_bin_count(size):
    return round(1 + math.log2(size))

def create_bins(df, col, bin_count):
    bin_width = df[col].max() // bin_count
    df[col] = (df[col] // bin_width) * bin_width
    return df

# 連続変数のビン分割
bin_count = get_bin_count(df.shape[0])
df = create_bins(df, 'cont_var1', bin_count)
df = create_bins(df, 'cont_var2', bin_count)
# ビンごとに残った連続変数の集計
heatmap_input = pd.pivot_table(df, index='cont_var1', columns='cont_var2', values='cont_var3', aggfunc=np.sum).fillna(0)
3.ヒートマップの生成
最後に、2の集計結果をimshowを使ってプロットします。
プロットする際には下記に注意すると混乱が少ないと思います。
- imshowメソッドを呼ぶ際にはextent引数を設定すること
これを設定しないと各軸のラベルにテーブルのインデックス番号とカラム番号が利用されてしまいます - invert_yaxis()を呼ぶこと
デフォルトの原点はグラフの左上に設定されているため、これを設定しないとy軸に関して反転したグラフが描画されてしまいます
import matplotlib.pyplot as plt

fig = plt.figure()
ax = fig.add_subplot(111)
hmap = ax.imshow(hmap_input,
                 extent=[hmap_input.columns.min(),
                         hmap_input.columns.max(),
                         hmap_input.index.max(),
                         hmap_input.index.min()],
                 cmap='viridis')
ax.invert_yaxis()
ax.set_title('SUM')
ax.set_xlabel('cont_var1')
ax.set_ylabel('cont_var2')
fig.colorbar(hmap, ax=ax)
plt.show()
これを実行すると冒頭で示したヒートマップが描画されます。
おわりに
今回は簡単に和を3軸目(色)にプロットしましたが、集計方法を変更することでいろいろ試せると思います。参考にしていただけると幸いです。
イメージのプロットによく利用するimshowメソッドを流用したこの手法を思いついた時は、「お、自分やるじゃん」と思ってしまいましたが、割とメジャーな方法だったということをあとで調べて知りました。前もって調べるの大事ですね。

