アドベントカレンダー14日目の記事です。
昨日は、@Tyanri_の【CreateJS】カラーパレットを使わない色の選択でした✨
今日のテーマ
今年話題沸騰中のStreamlit!
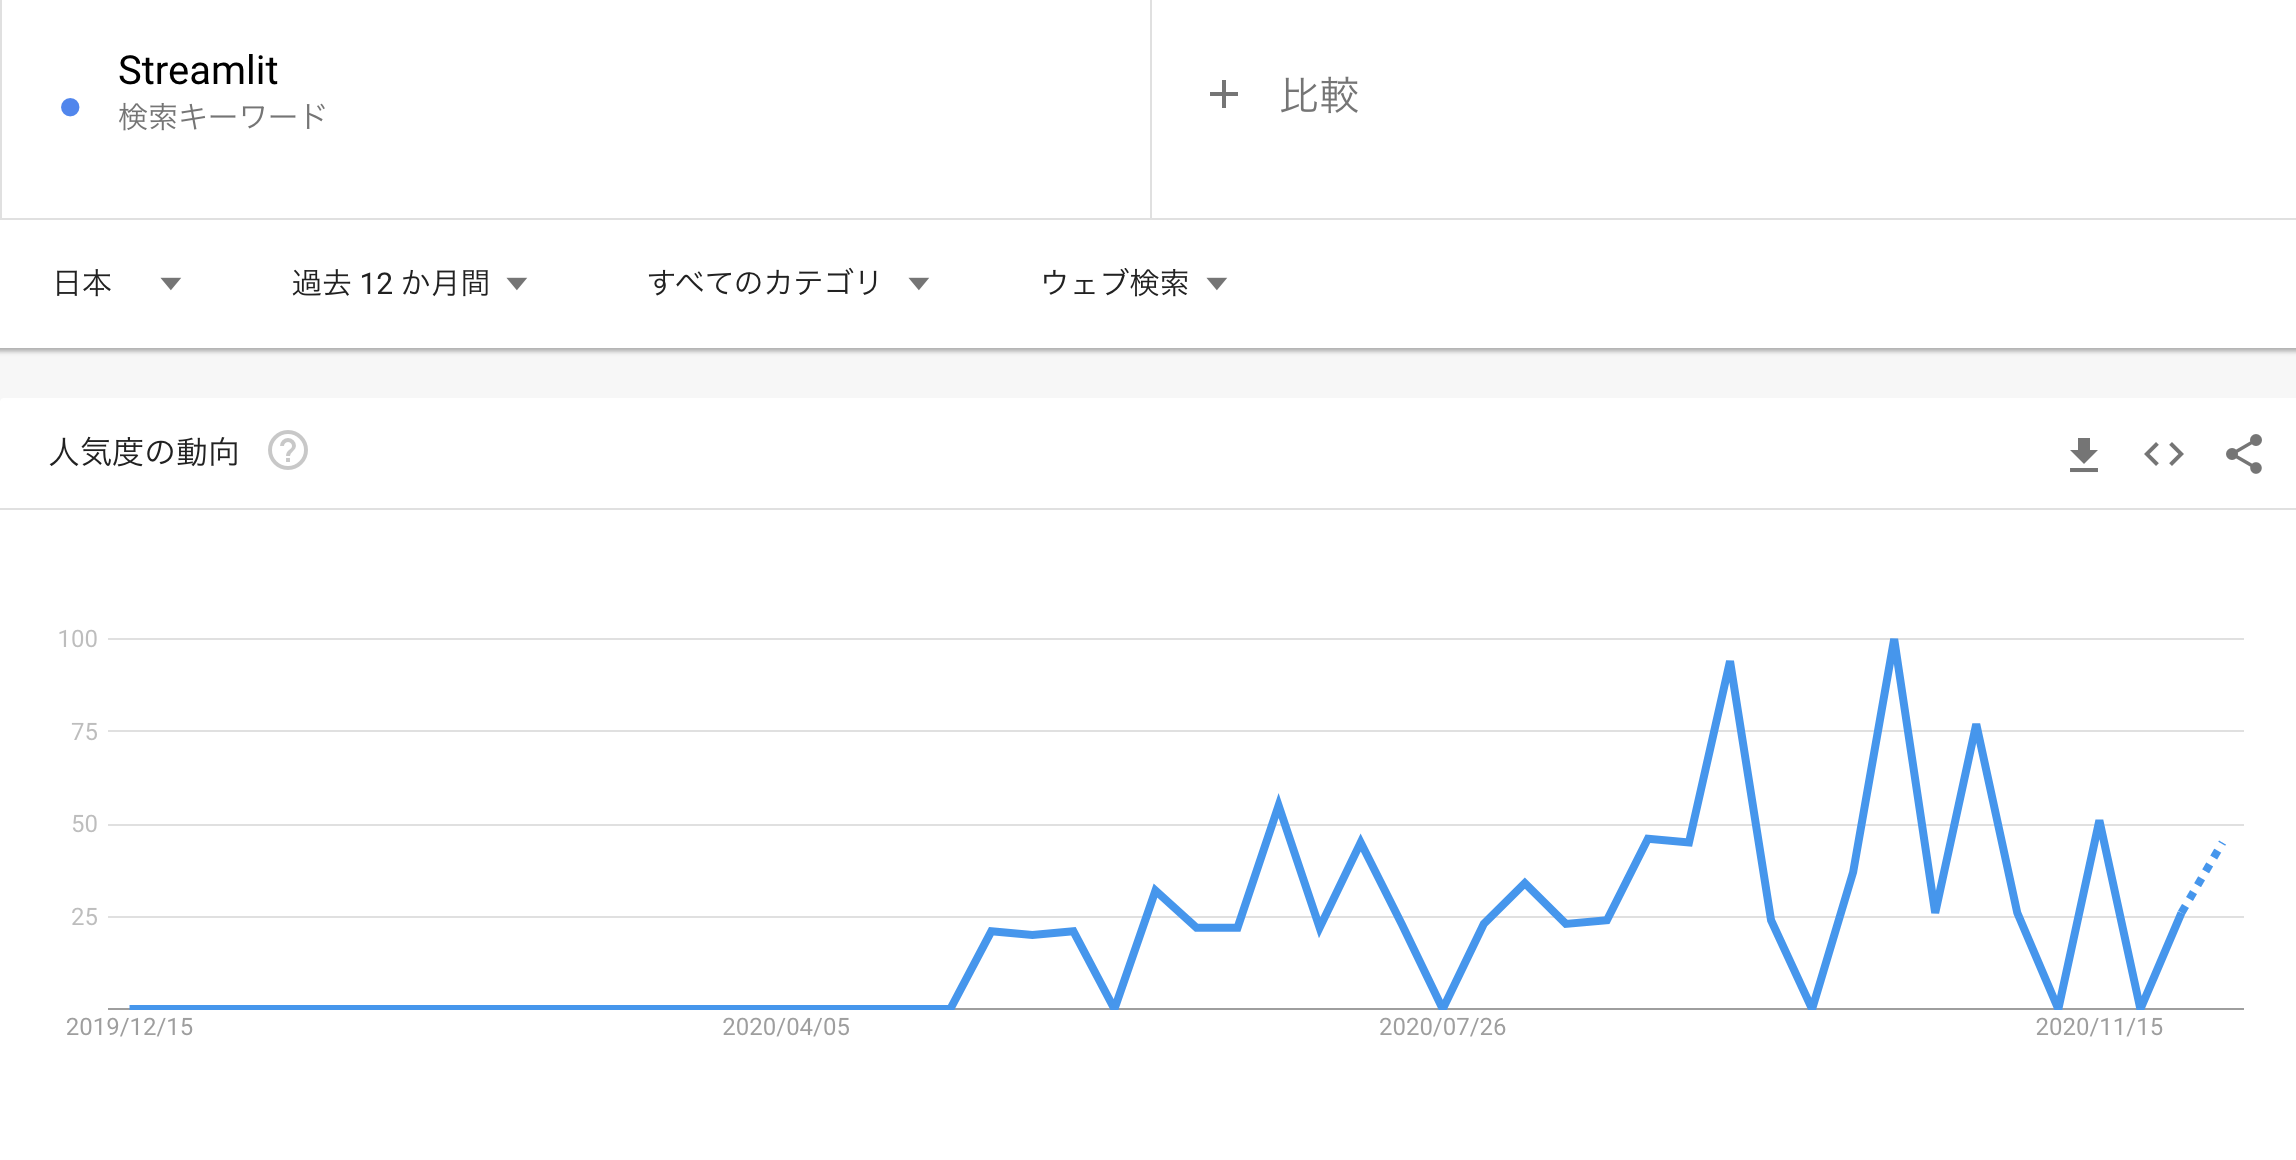
なにやら爆速でアプリ開発できるらしい、、
Streamlitの準備
Streamlitとは、HTML、CSS、JavaScriptを一切書かずに、データ可視化アプリをめちゃ簡単に作られるオープンソースのPythonライブラリです。
インストールして、
$ pip install streamlit
サンプルアプリをみてみる
$ streamlit hello
メールアドレスを入力すると、http://localhost:8501
にて表示されます
いざ開発
どんなアプリにする?
来月くらいから4年生は卒業旅行シーズンです!
最近旅行に行くと、私は車を運転することが多くなってきたのですが
有名な夜景とかも見に行けたら楽しそうだなあ、、
ということで、ドライブ中に立ち寄れそうなスポットを可視化したアプリを作ってみます
日本百選のデータをいただく
万物はすべて座標値(経緯度数値)を持っているにて、様々な日本百選のデータが公開されています
その中から個人的に興味がある以下の3つのデータを使用します
- 日本の夕陽百選
NPO法人「日本列島夕陽と朝日の郷づくり協会」が2005(平成17)年に認定したもの
- 夜景100選
新日本三大夜景・夜景100選事務局が夜景スポットを管理する全ての役所・企業に確認を行い、2004(平成16)年に公表したもの
- 快水浴場百選
環境省が2006(平成18)年に人々が水に直接触れることができる個性ある水辺を積極的に評価し、これらの快適な水浴場を広く普及することを目的として選定したもの
実装
import streamlit as st
import pandas as pd
import numpy as np
import matplotlib.pyplot as plt
import seaborn as sns
yuhi = 'src/yuhi02.csv'
yakei = 'src/yakei02.csv'
kaisui = 'src/kaisui02.csv'
@st.cache
def load_data(file):
df_load = pd.read_csv(file,encoding='shift-jis')
# 経度緯度をmapで認識できるように修正
df1 = df_load.rename(columns={'北緯': 'lat','東経':'lon'})
# 所在地を都道府県と市区町村に分割
df2 = pd.concat([df1,df1['所在地'].str.extract('(?P<都道府県>...??[都道府県])(?P<市区町村>.*)', expand=True)], axis=1).drop('所在地', axis=1)
return df2
def main():
st.title('日本のドライブで寄れそうなスポット')
block_list = ['夕陽', '夜景', '海水']
control_features = st.sidebar.selectbox('何を楽しみたい?',block_list)
st.header(f'{control_features}100選')
if control_features == '夕陽':
visualize(yuhi)
elif control_features == '夜景':
visualize(yakei)
elif control_features == '海水':
visualize(kaisui)
def visualize(file):
df = load_data(file)
st.dataframe(df[['名称','都道府県','市区町村']])
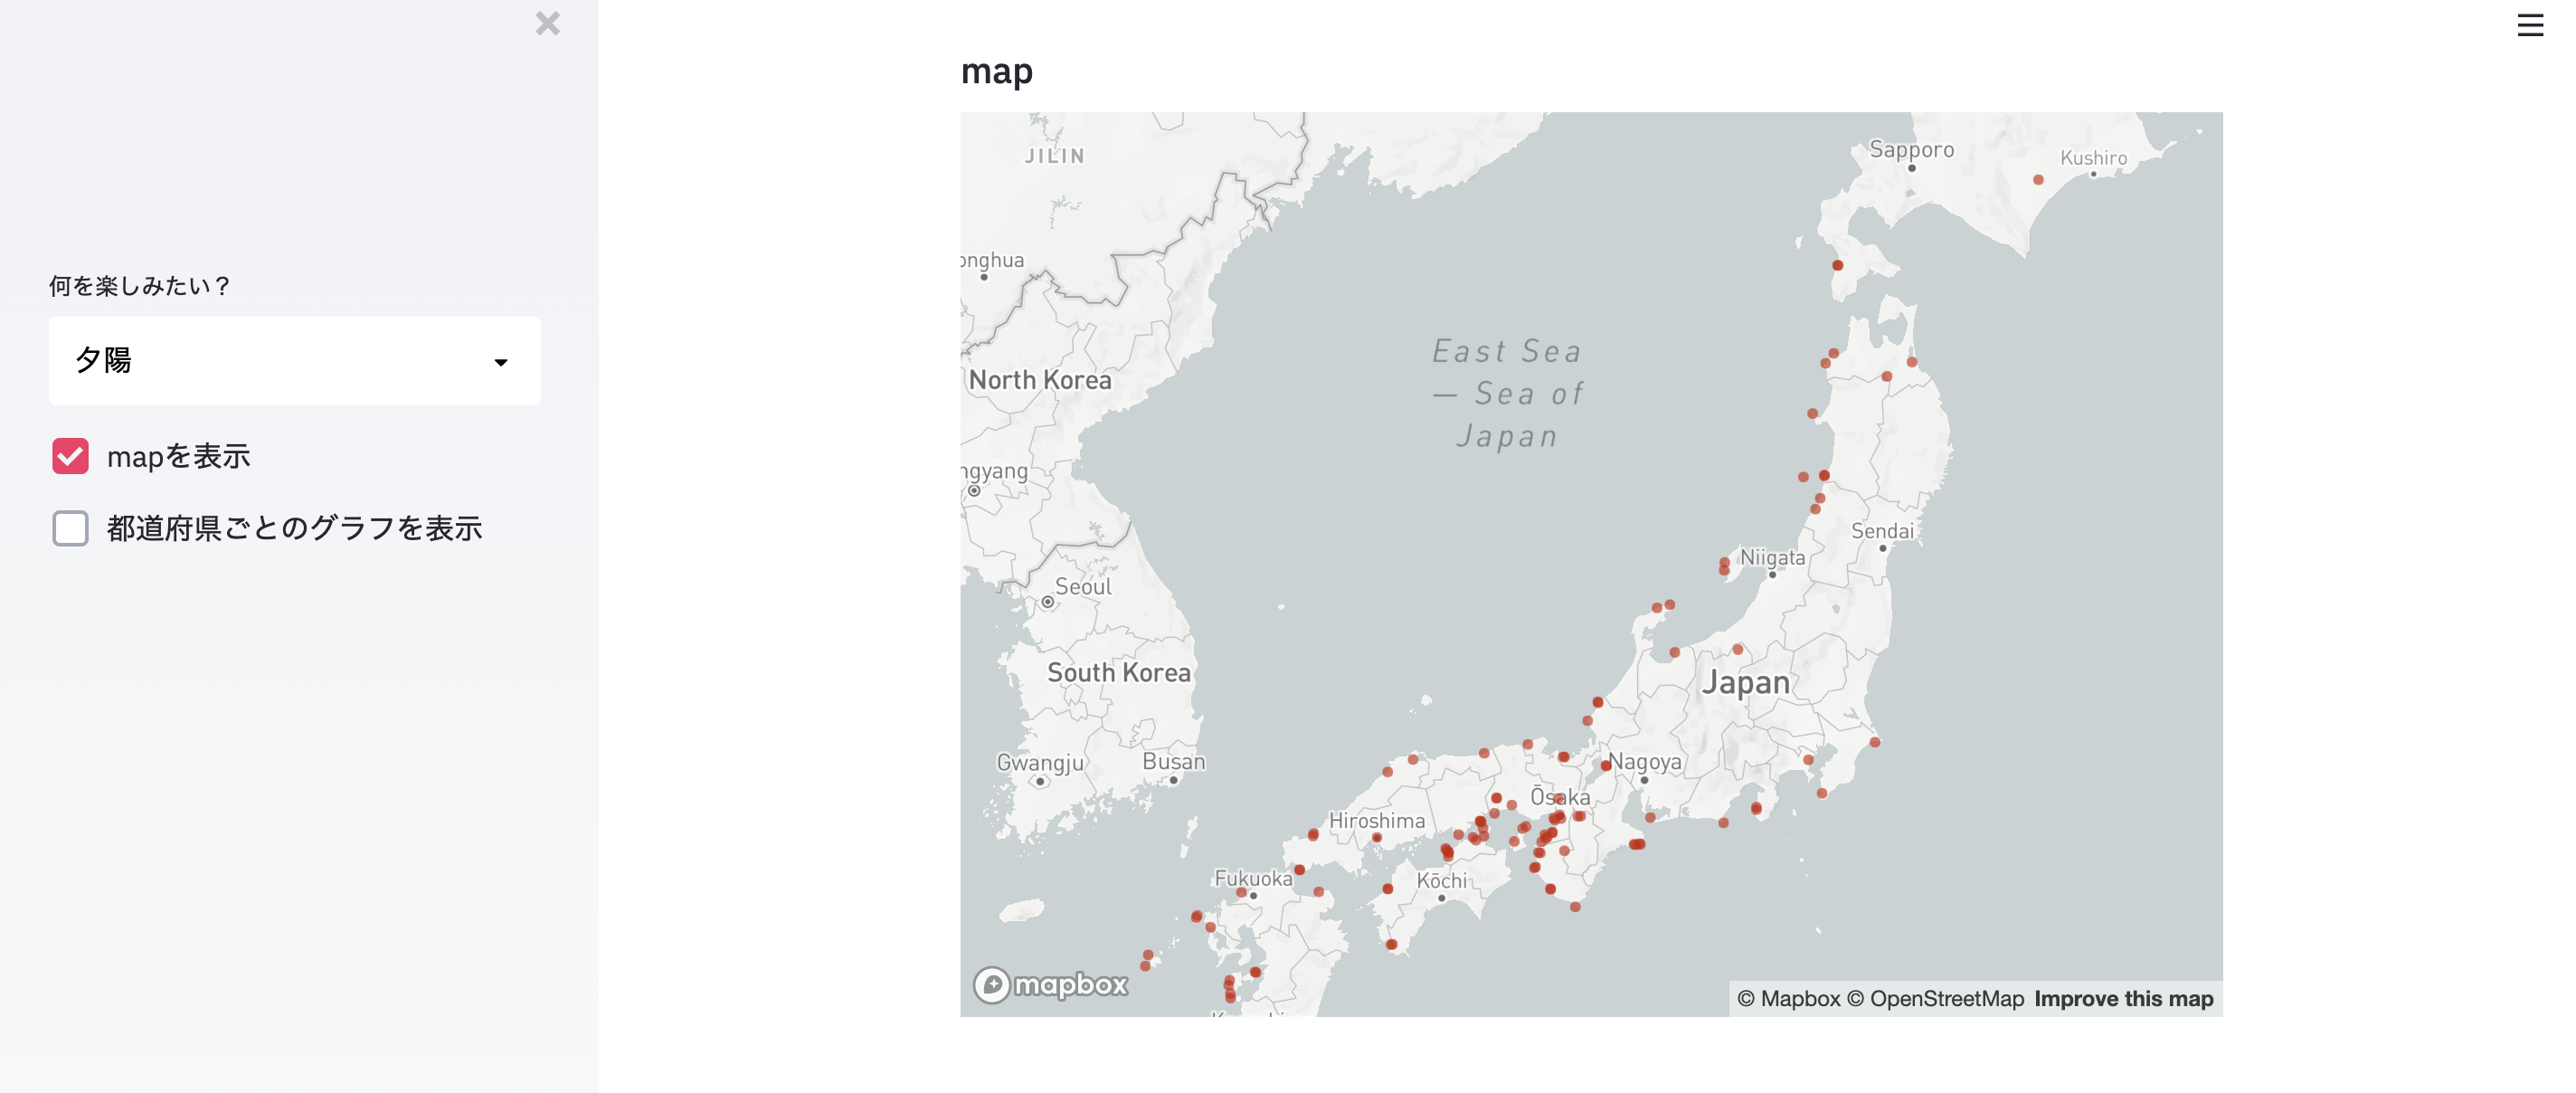
if st.sidebar.checkbox('mapを表示'):
st.subheader('map')
st.map(df)
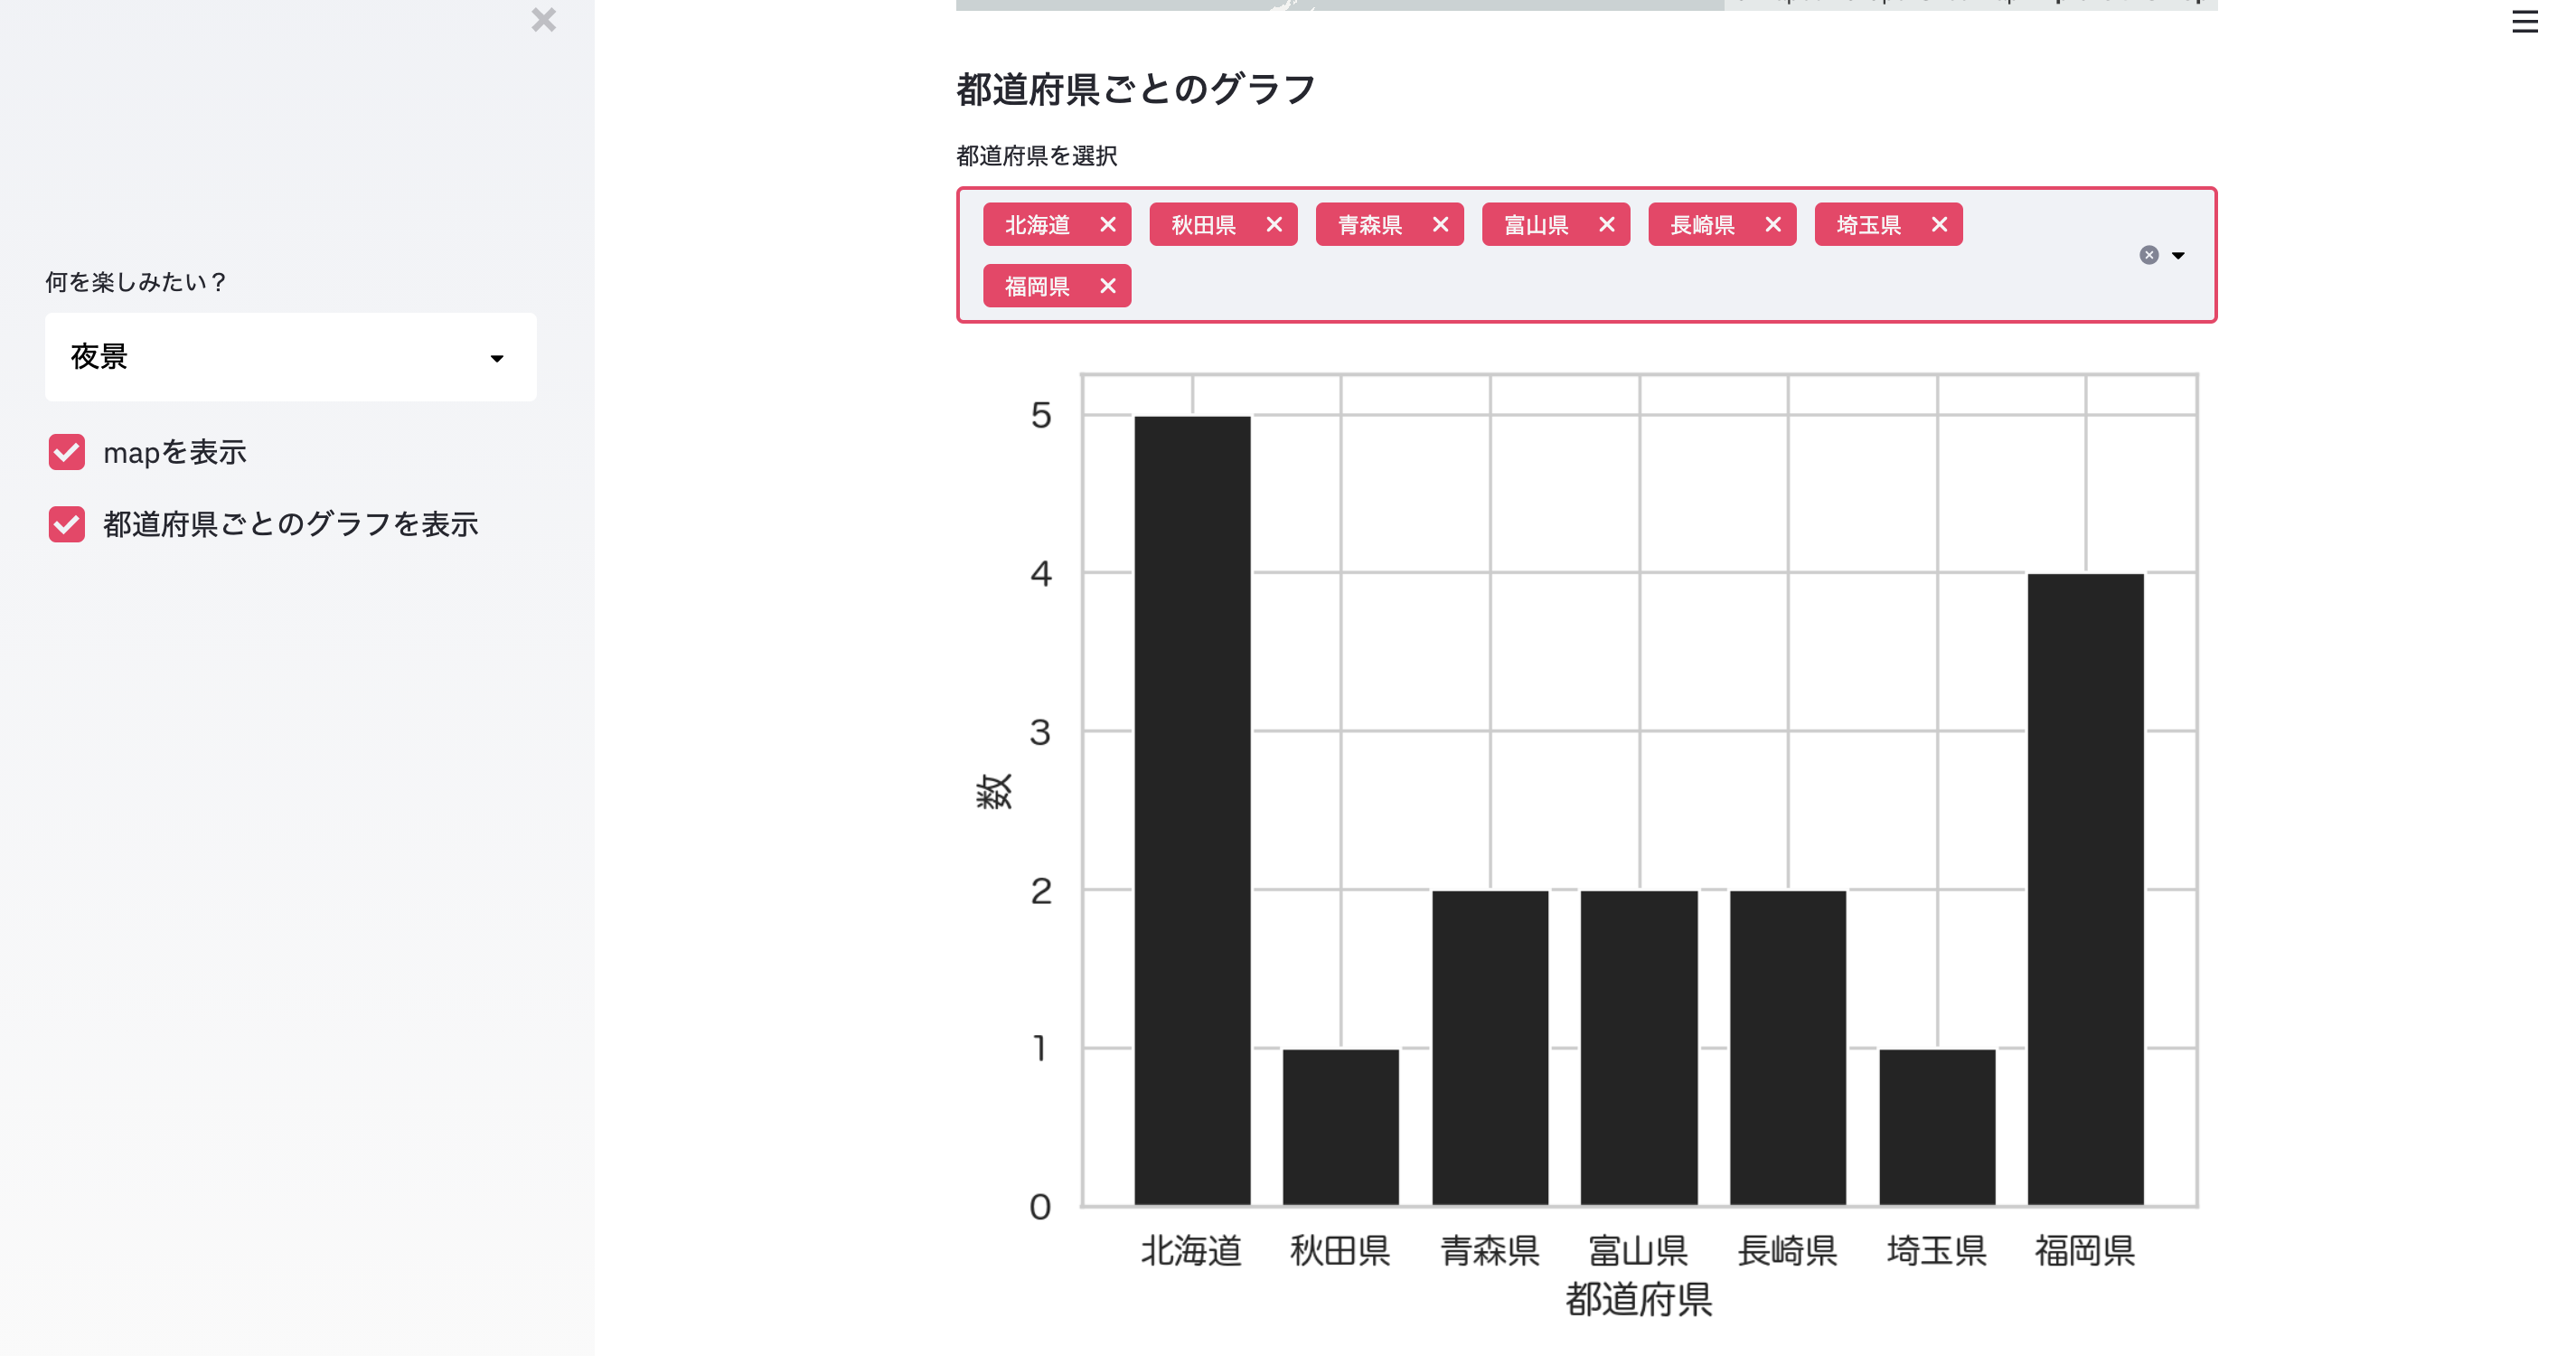
if st.sidebar.checkbox('都道府県ごとのグラフを表示'):
st.subheader('都道府県ごとのグラフ')
selected_prefectures = st.multiselect('都道府県を選択',df['都道府県'].unique().tolist(),['北海道','秋田県','青森県','富山県'])
n = [(df['都道府県'] == prefecture).sum() for prefecture in selected_prefectures]
# 棒グラフで表示
sns.set(font="IPAexGothic")
sns.set_style('whitegrid')
sns.set_palette('gray')
x = np.array(selected_prefectures)
y = np.array(n)
x_position = np.arange(len(x))
fig = plt.figure()
ax = fig.add_subplot(1, 1, 1)
ax.bar(x_position, y, tick_label=x)
ax.set_xlabel('都道府県')
ax.set_ylabel('数')
st.pyplot(fig)
if __name__ == "__main__":
main()
デフォのままだと文字化けするので、【Seaborn】日本語を表示する (フォントを変更する)のように、フォントの設定をしてください
streamlit run ファイル名で実行
$ streamlit run st_drive.py
できたもの
いろいろ動かせて面白い
しっかりレスポンシブにも対応しちゃうあたりすごい👏
https://drive.google.com/file/d/1eKsnQFUGnrt3-v_oNiwn67JMUTWqz6xO/view?usp=sharing
デプロイもできちゃう
Streamlitでデプロイもできてしまう、、!
https://docs.streamlit.io/en/stable/deploy_streamlit_app.html
に沿ってするとできます
おわり
感動!早い!たのしい!
公式ドキュメントの充実度が神なので、他の機能なども是非みてみてください!