Torchvizのインストール
$ pip install torchviz
ネットワークの定義
- 可視化したいネットワークを定義する
- 本稿では,ニューラルネットワークを可視化する
NeuralNet.py
import torch
import torch.nn as nn
import torch.nn.functional as F

INPUT_SIZE = 10

class NeuralNet(nn.Module):
    def __init__(self):
        super(NeuralNet, self).__init__()
        self.fc1 = nn.Linear(INPUT, 256)
        self.fc2 = nn.Linear(256, 128)
        self.fc3 = nn.Linear(128, 10)

    def forward(self, x):
        x = self.fc1(x)
        x = F.relu(x)
        x = self.fc2(x)
        x = F.relu(x)
        x = self.fc3(x)
        x = F.softamx(x)

        return x
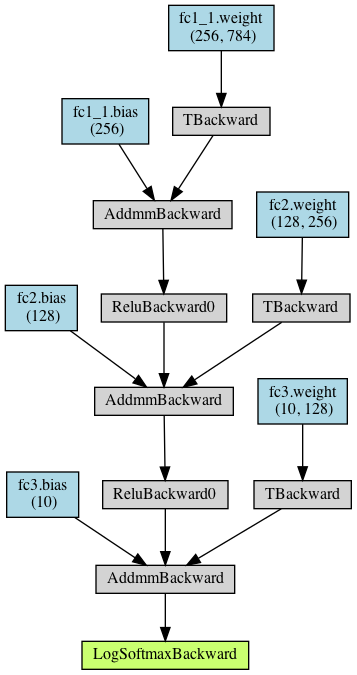
torchvizによる計算グラフの可視化
- torchviz.make_dotにより可視化
- 入力サイズに合わせたデータを用意し,モデルに流す
- その出力と,モデルのパラメータを指定して画像を出力する
visualize_NeuralNet.py
import torch

from torchviz import make_dot
from NeuralNet import NeuralNet

INPUT_SIZE = 28*28

model = NeuralNet()
data = torch.randn(1, INPUT_SIZE)

y = model(data)

image = make_dot(y, params=dict(model.named_parameters()))
image.format = "png"
image.render("NeuralNet")