こういうGIFを作った話
単純なグラフなどは matplotlib の機能でもできるが、上記の画像など複雑になるにつれ厳しくなってくる
なのでライブラリを探した結果 animatplot がよさそうだったのでこれを使う。
簡単なグラフに関しては公式のチュートリアルが用意されている。
今回のような複数のグラフを使うコードは以下の通り。
import numpy as np
import matplotlib.pyplot as plt
import animatplot as amp
from pylab import rcParams
rcParams['figure.figsize'] = 16, 8
%matplotlib ipympl # lab
%matplotlib qt
fs = 40000.0
fc = 40.0
fm = 4.0
fig, (ax1, ax2, ax3, ax4) = plt.subplots(4, 1)
for ax in [ax1, ax2, ax3, ax4]:
ax.axis('off')
time = np.arange(fs) / fs
ts = np.linspace(0, 1, 100)
Xs, Ts = np.meshgrid(time, ts)
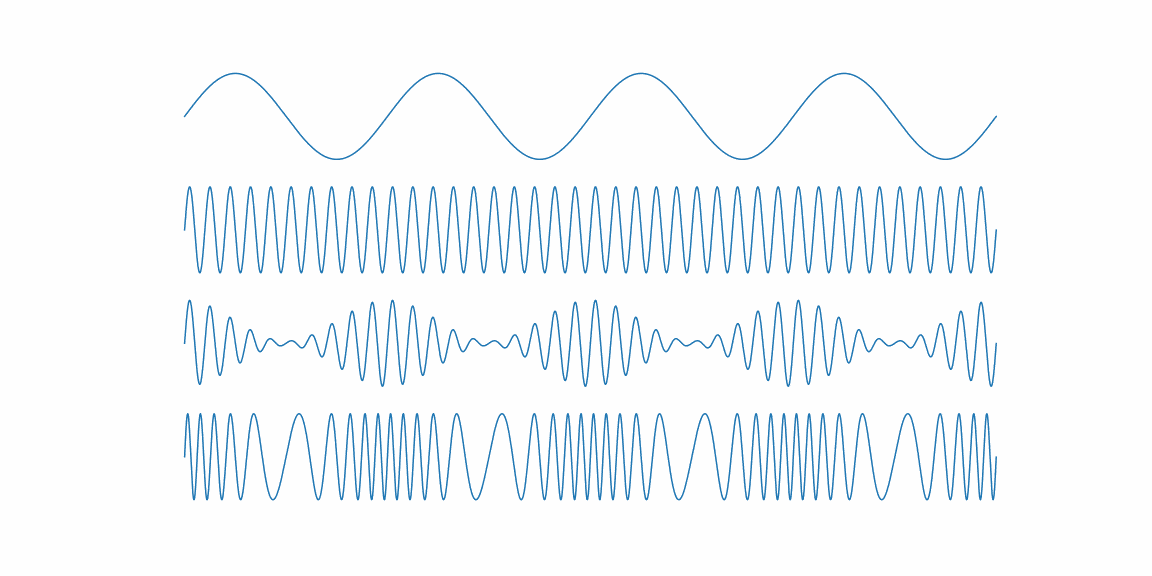
Y_modulator = np.sin(2.0 * np.pi * fm * (Ts + Xs))
Y_carrier = np.sin(2.0 * np.pi * fc * (Ts + Xs))
Y_am = np.sin(2. * np.pi * fc * (Ts + Xs)) * (1 + 0.9 * np.cos(2.0 * np.pi * fm * (Ts + Xs)))
Y_fm = np.sin(2. * np.pi * (fc * (Ts + Xs) + Y_modulator))
B_modulator = amp.blocks.Line(Xs, Y_modulator, ax=ax1)
B_carrier = amp.blocks.Line(Xs, Y_carrier, ax=ax2)
B_am = amp.blocks.Line(Xs, Y_am, ax=ax3)
B_fm = amp.blocks.Line(Xs, Y_fm, ax=ax4)
anim = amp.Animation([B_modulator, B_carrier, B_am, B_fm])
anim.save_gif("am_fm")
基本的には matplotlib の使い方と同じで、アニメーションを行う軸を ax で指定する。
最後に amp.Animation で複数のブロックを指定する。
アニメーションを付けるとわかりやすいので、今後も活用していきたい。