この記事について
Pod の Resources Requests の設定が Kubernetes の Pod スケジューリングにどう影響を与えるかまとめる。
なお、リソースの種類は cpu と memory に限定して記載する(他の種類のリソースも存在するがここでは触れない)。
Pod の Resources の指定
Pod を作成する際には、以下のように Pod が使用するリソース(cpu/memory)を requests や limits で指定することができる。
apiVersion: v1
kind: Pod
metadata:
  name: nginx
spec:
  containers:
  - image: nginx:1.23
    name: nginx
    resources:
      requests:
        cpu: 100m
        memory: 32Mi
      limits:
        cpu: 500m
        memory: 128Mi
それぞれ大雑把に説明すると以下のようになる:
-
requests- Pod の作成に必要な最小リソース量の指定
- Kubernetes のスケジューラーが Pod を実行するノードを決める際に使われる
-
limits- Pod が使用可能な最大リソース量の指定
- kubelet が指定された値以上のリソースを使えないようコンテナを構成する
指定できる単位は以下の通り。詳しくは公式ドキュメントを参照。
- cpu: 1CPU(1コア)あたり 1000m(ミリCPUやミリコアと読む)。0~1の間の数値で指定することもでき、0.5 の場合は 500m を意味する。
- memory: バイト数。
Mi(メビバイト),Gi(ギビバイト)等を付けることも可能。
Pod の Requests の値
上で「Pod の作成に~」や「Pod が使用可能な~」と書いたが、マニフェストではこれらの値は Pod 単位ではなくコンテナ単位で指定する。
Pod としての Requests 値は各コンテナに指定された値の合計なのだが、Pod には初期化のために順番に1個ずつ実行される initContainers と、初期化後に複数同時に実行される containers がある。
Pod の Requests 値は各段階を通して最も大きな値を採用するので、「initContainers の中の最大値」と「containers の合計値」を比較して大きい方が Pod としての Requests の値になる。以下の例では、この Pod の Requests 値は次のようになる。
- CPU は、初期化後に必要な 200m + 100m = 300m
- Memory は、初期化時の init2 コンテナに必要な最大の 30Mi
spec:
  # 初期化用(1個ずつ実行される)
  initContainers:
  - name: init1
    resources:
      requests:
        cpu: 200m
        memory: 10Mi
  - name: init2
    resources:
      requests:
        cpu: 200m
        memory: 30Mi
  # 初期化後(同時に実行される)
  containers:
  - name: cont1
    resources:
      requests:
        cpu: 200m
        memory: 10Mi
  - name: cont2
    resources:
      requests:
        cpu: 100m
        memory: 10Mi
実際に上記の内容で Pod(multi という名前)をデプロイして以下のコマンドを実行すると CPU 300m、Memory 30Mi を確認できる。
$ kubectl describe node worker1
...
Non-terminated Pods:   (15 in total)
  Namespace            Name           CPU Requests  CPU Limits  Memory Requests  Memory Limits  Age
  ---------            ----           ------------  ----------  ---------------  -------------  ---
  default              multi          300m (15%)    0 (0%)      30Mi (0%)        0 (0%)         20m
Pod のスケジューリング
Pod のデプロイ時は、Pod の Requests 値と Kubernetes の各ノードのリソース使用量を見て、Pod の実行に最も適切なノードが選択される。これをスケジューリングというが、そのためには各ノードで使用中または使用可能なリソース量を知る必要がある。具体的にどの値か?
ノードのリソース
ノードのリソースとして取得できる値を以下にまとめてみる。
kubectl describe node で見れる値
kubectl describe node コマンドを実行した場合、Capacity、Allocatable、Non-terminated Pods、Allocated resources といった複数の値が表示される。
先に内容を書くと、これらは「実際のリソース使用量」ではなく「事前定義された値、または、それを合算した値」が表示される。
Capacity
Capacity:
  cpu:                2
  ephemeral-storage:  129407108Ki
  hugepages-1Gi:      0
  hugepages-2Mi:      0
  memory:             4025460Ki
  pods:               110
そのノードが持つ全リソース量を表す。ノードが VM なら、その仮想CPUコア数とメモリ量になる。
Allocatable
Allocatable:
  cpu:                2
  ephemeral-storage:  119261590536
  hugepages-1Gi:      0
  hugepages-2Mi:      0
  memory:             3923060Ki
  pods:               110
ノード上では OS 自身や Kubernetes のコンポーネントが動作するので、Capacity のすべてを Pod に使わせることはできない。Capacity から OS や Kubernetes 等が使うための予約リソース量を引いた、Pod に割り当て可能なリソース量を Allocatable という。
(Reserve Compute Resources for System Daemonsから引用)
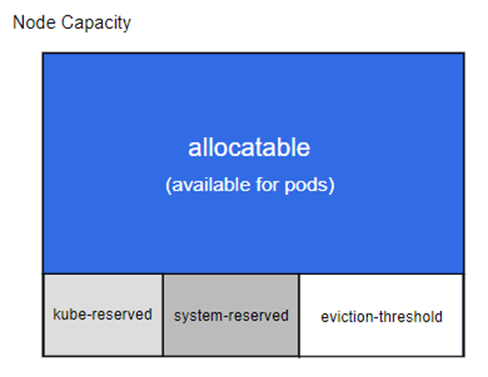
上図で Allocatable に含まれない部分は以下になる:
- kube-reserved
- Kubernetes のコンポーネント(kubelet, container runtimeなど)用に予約されたリソース量
- system-reserved
- OS(カーネルやデーモン)用に予約されたリソース量
- eviction-threshold
- ノードの空きメモリがこの値を下回ったら Pod が終了される閾値 (eviction という動作)
- 例えばこの閾値が500MBの場合、Pod はその 500MB を使えないので Allocatable に含まれない
誤解しやすいのが Allocatable が現時点での空きリソース量と思ってしまうこと。Allocatable は全リソース量の Capacity から事前定義された予約リソース量を引いただけなので、固定値になる。
Non-terminated Pods
Non-terminated Pods:          (4 in total)
  Namespace                   Name                               CPU Requests  CPU Limits  Memory Requests  Memory Limits  Age
  ---------                   ----                               ------------  ----------  ---------------  -------------  ---
  default                     nginx                              100m (5%)     0 (0%)      100Mi (2%)       0 (0%)         4s
  kube-system                 kube-proxy-wq6tb                   0 (0%)        0 (0%)      0 (0%)           0 (0%)         14d
  kube-system                 metrics-server-696f4844bb-7txjt    100m (5%)     0 (0%)      200Mi (5%)       0 (0%)         7d
  kube-system                 weave-net-x24v7                    100m (5%)     0 (0%)      200Mi (5%)       0 (0%)         36d
当該ノード上で動いてる Pod の Requests と Limits を表示しているだけ。
Allocated resources
Allocated resources:
  (Total limits may be over 100 percent, i.e., overcommitted.)
  Resource           Requests     Limits
  --------           --------     ------
  cpu                300m (15%)   0 (0%)
  memory             500Mi (13%)  0 (0%)
  ephemeral-storage  0 (0%)       0 (0%)
  hugepages-1Gi      0 (0%)       0 (0%)
  hugepages-2Mi      0 (0%)       0 (0%)
上記 Non-terminated Pods の値を合計、つまり動作中の Pod の Requests と Limits の合計が表示される。
kubectl top で見れる値
現在の実際のリソース使用量を表示できる。
$ kubectl top node
NAME       CPU(cores)   CPU%   MEMORY(bytes)   MEMORY%
worker1    66m          3%     1954Mi          51%
worker2    24m          1%     504Mi           13%

$ kubectl top pod ubuntu
NAME     CPU(cores)   MEMORY(bytes)
ubuntu   0m           8Mi
(補足) kubectl top は Metrics API を使うので、値を表示するには Kubernetes 上で Metrics Server を実行しておく必要がある。
スケジューラーが参照するリソース量
では、スケジューラーが Pod を実行するノードを決定する際に「事前定義または計算されたリソース量」と「実際のリソース使用量」のどちらを参照するかというと前者になる。より具体的に言うと、以下の Allocated resources の Requests、つまり、全 Pod の Requests 値の合計を見る。
$ kubectl describe node worker1
...
Allocated resources:
  (Total limits may be over 100 percent, i.e., overcommitted.)
  Resource           Requests     Limits
  --------           --------     ------
  cpu                300m (15%)   0 (0%)
  memory             500Mi (13%)  0 (0%)
スケジューラーは新しい Pod の実行ノードを決定する際に、この Requests の合計値が Allocatable(Pod に割り当て可能な全リソース量)を超えないかをチェックする。もし超える場合は Insufficient cpu や Insufficient memory といった時々目にするエラーを返す。
ここで大事なのは、「実際のリソース使用量」ではなく Requests の合計値を見ていること。そのため、実際に CPU/Memory がほとんど使われてなくても、Requests の合計値が Allocatable を超えると Pod の作成がエラーになる。「CPU もメモリも全然使われてないのに、リソース不足のエラーで Pod が作成できない」というのはこの場合に該当する。
これについては、公式ドキュメントにも以下のように記載されている。
The scheduler ensures that, for each resource type, the sum of the resource requests of the scheduled containers is less than the capacity of the node. Note that although actual memory or CPU resource usage on nodes is very low, the scheduler still refuses to place a Pod on a node if the capacity check fails. This protects against a resource shortage on a node when resource usage later increases, for example, during a daily peak in request rate.
スケジューラーが具体的に Pod の Requests と Allocated resources をどう比較しているかは、ソースを見た方が分かりやすい。Insufficient cpu や Insufficient memory のエラーもここで返される。
kubernetes/pkg/scheduler/framework/plugins/noderesources/fit.go
func fitsRequest(podRequest *preFilterState, nodeInfo *framework.NodeInfo, ignoredExtendedResources, ignoredResourceGroups sets.String) []InsufficientResource {
    insufficientResources := make([]InsufficientResource, 0, 4)
    //...

	if podRequest.MilliCPU > (nodeInfo.Allocatable.MilliCPU - nodeInfo.Requested.MilliCPU) {
		insufficientResources = append(insufficientResources, InsufficientResource{
			ResourceName: v1.ResourceCPU,
			Reason:       "Insufficient cpu",
			Requested:    podRequest.MilliCPU,
			Used:         nodeInfo.Requested.MilliCPU,
			Capacity:     nodeInfo.Allocatable.MilliCPU,
		})
	}
	if podRequest.Memory > (nodeInfo.Allocatable.Memory - nodeInfo.Requested.Memory) {
		insufficientResources = append(insufficientResources, InsufficientResource{
			ResourceName: v1.ResourceMemory,
			Reason:       "Insufficient memory",
			Requested:    podRequest.Memory,
			Used:         nodeInfo.Requested.Memory,
			Capacity:     nodeInfo.Allocatable.Memory,
		})
	}
補足:
後述するスケジューリングの全過程で、「実際のリソース使用量」を参照してないかは自分はまだ分かっていない。補足『スケジューリング時の「実際のリソース使用量」の評価』を参照。
スケジューラー
ここまでスケジューラーについてあまり説明せず話を進めてしまったので、ここで簡単に説明を記載する。
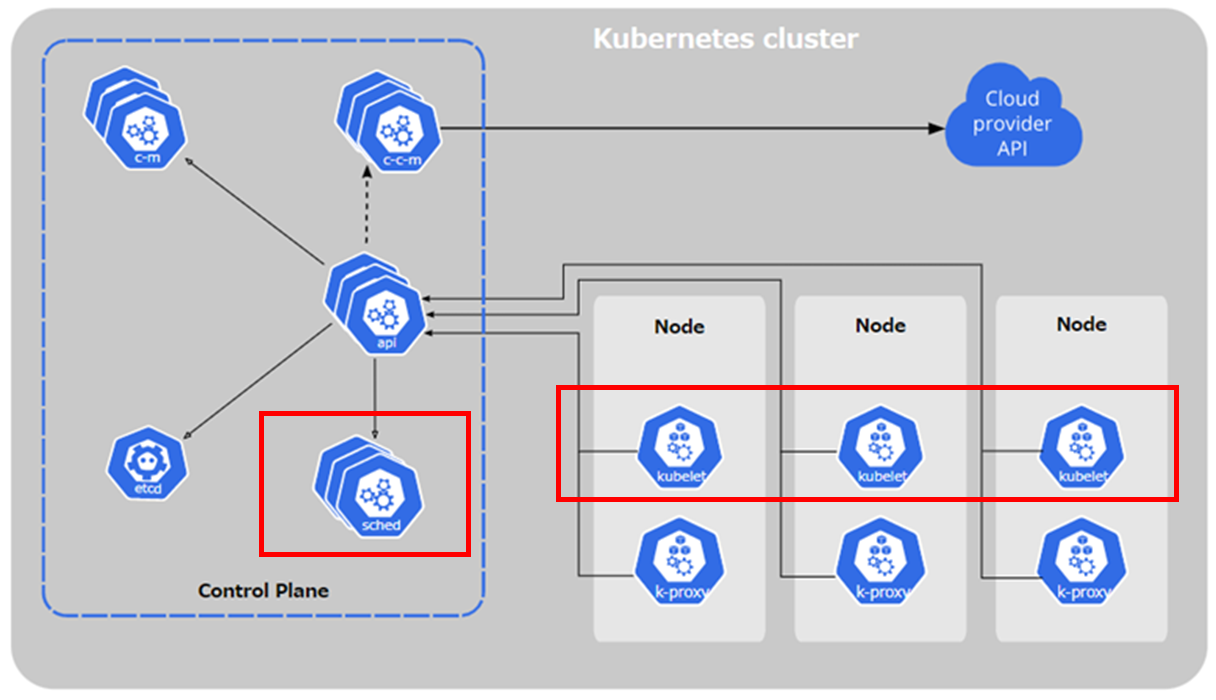
スケジューラーとは?
スケジューラーは Kubernetes のコンポートであり、Pod を実行するノードを決定する。最初に以下のような Pod の動作要件を満たすノードを選別し、要件を満たすノードが複数ある場合はそれらにスコアを付けてそのうちの1台を決定する。
- Pod が要求するリソース(CPU, Memory)
- Affinity (NodeName, NodeAffinity, PodAffinity ...etc)
- Taint
- Volume
- Pod Topology Spread
- などなど
なお、スケジューラーがやることは Pod を動かすノードの決定までで、実際に Pod を実行するのは kubelet の仕事になる。
スケジューリングの構成と流れ
ノードの選別やスコア付けは様々な観点から行う必要があり、さらに、環境依存の部分もある(例えば、Volume に関しては、実体が AWS EBS、GCE 永続ディスク、Azure Disk かによって実装が異なる)。
そのため、スケジューラーはこれらの選別やスコア付けのロジックをプラグインとして実装して柔軟に入れ替えられるアーキテクチャーになっている。 そして、スケジューリング過程のいくつかの箇所(これを Extension Points と呼ぶ)からそれらプラグインを呼び出して処理を進める。
以下の図は、スケジューリングの過程を表したもの。
https://kubernetes.io/docs/concepts/scheduling-eviction/scheduling-framework/#extension-points
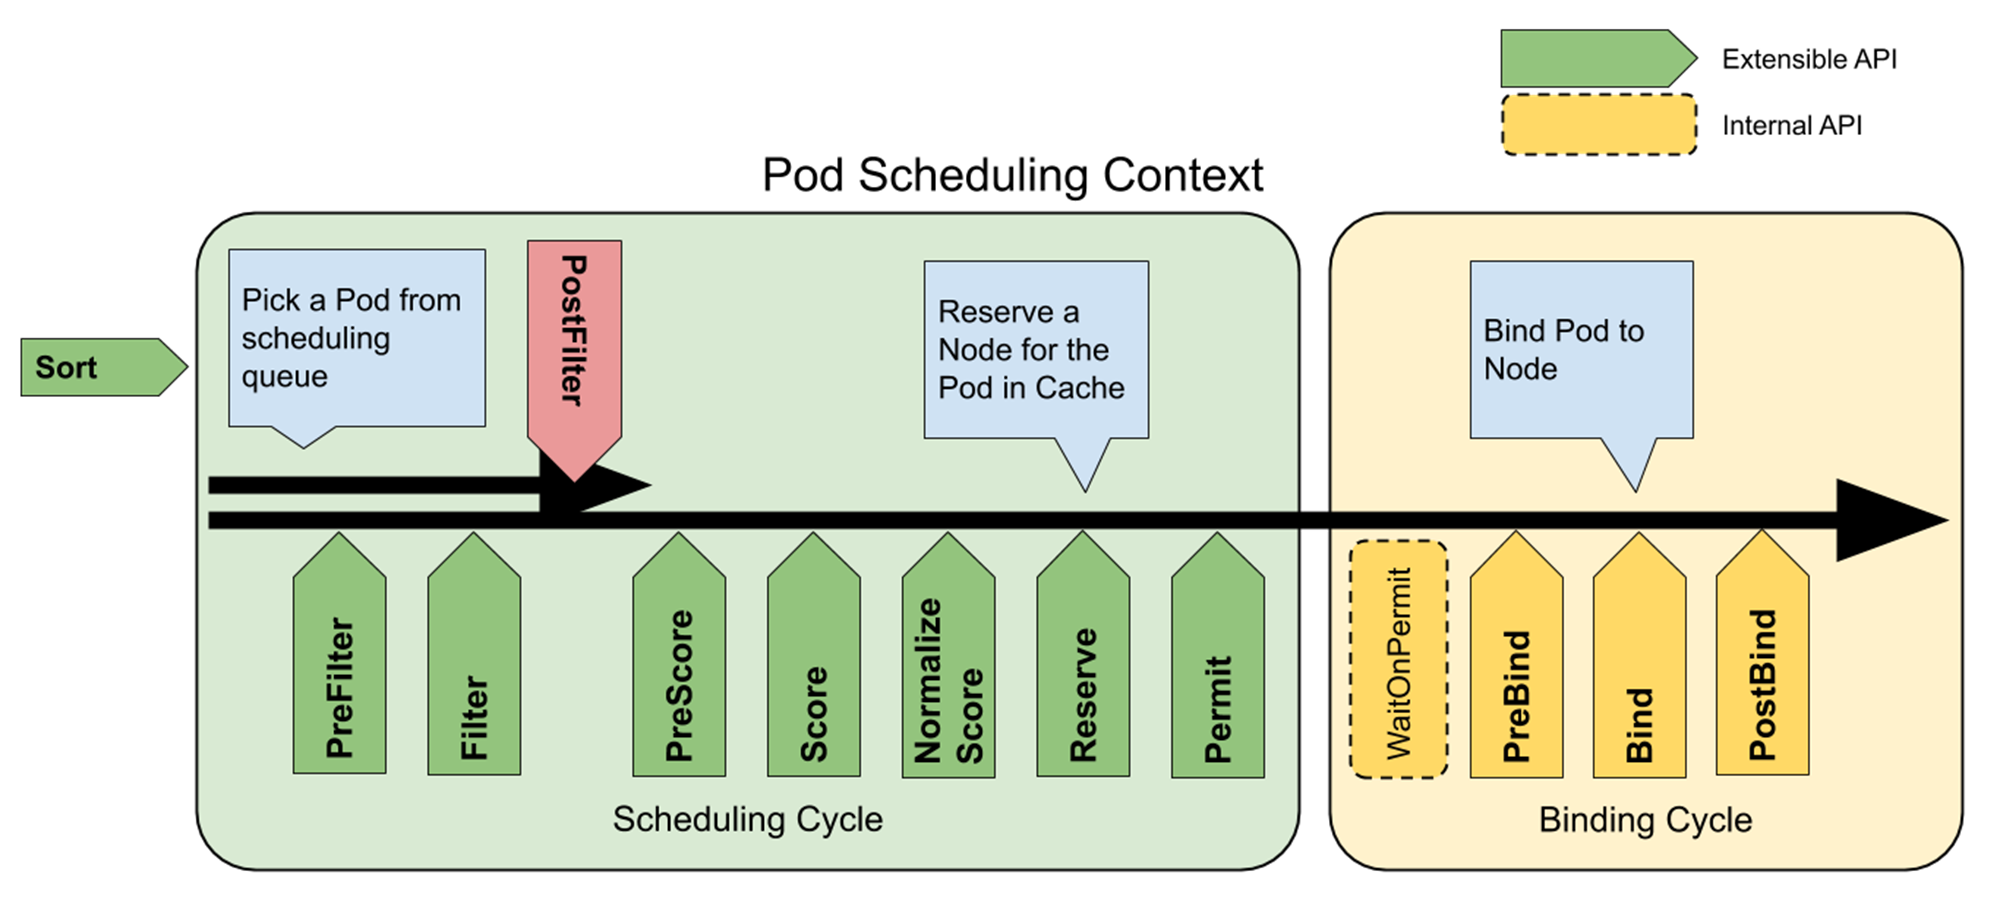
まず大きく分けて、次の2段階に分かれる(なお、これらを合わせて scheduling context と呼ぶ)。
- Scheduling Cycle
- Pod を実行するノードを決定する
- Binding Cycle
- 決定したノード名を Pod リソースに反映する(詳細は、補足の「スケジューラーの Binding Cycle について」を参照)
さらに前半の Scheduling Cycle は、ノードの選別を行う Filter 関連と、選別されたノードにスコア付けを行う Score 関連の処理に分かれる。ここまで書いてきた Resource Requests の値のチェックは主にこの Filter の段階で行われる。
スケジューリングは、各 Extension Points に登録されたプラグインを呼びながら処理を進める。一部のプラグインしか書いてないが、例えば以下のような感じになる。
※ プラグインの一覧は公式ドキュメントの Scheduling plugins を参照。
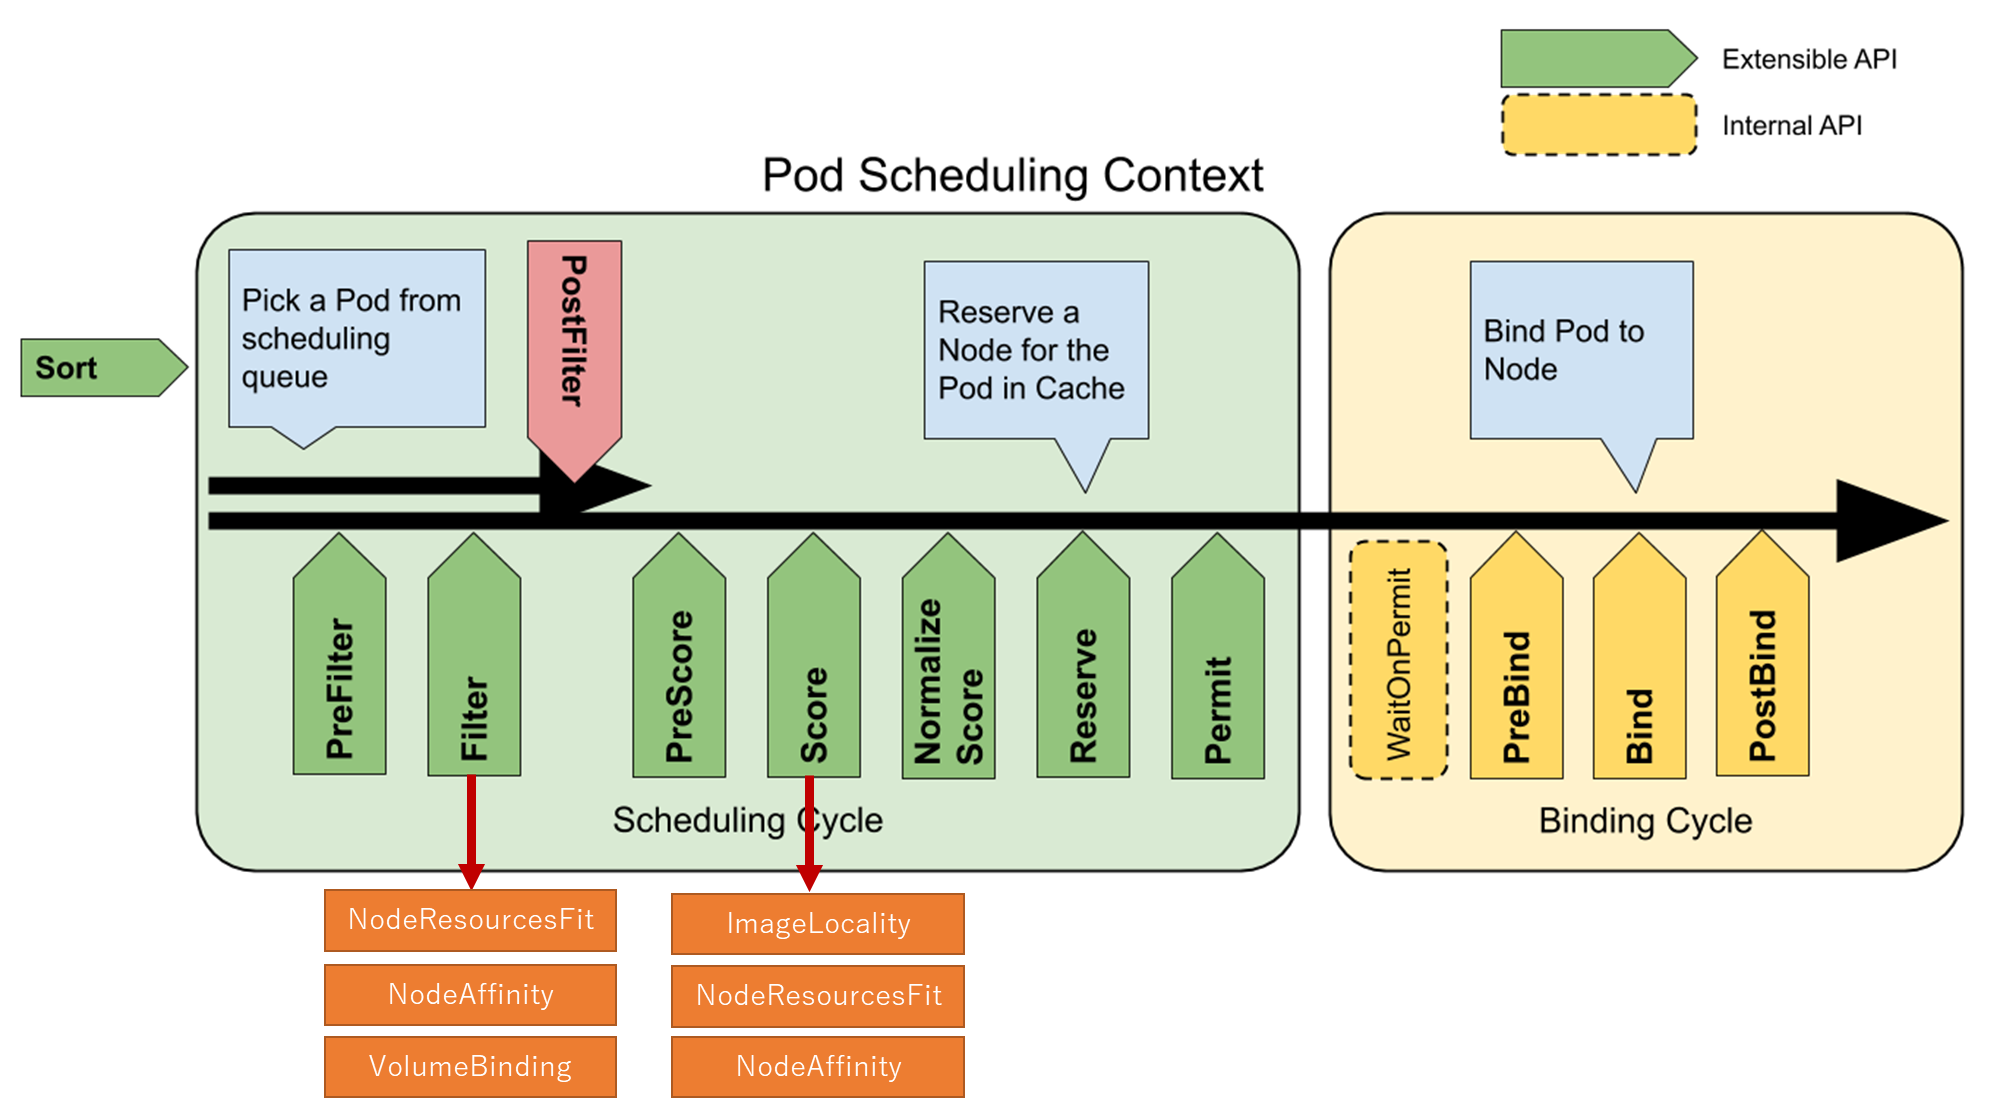
なお、Filter の Extension Point から呼ばれる Resource Requests のチェックは NodeResourcesFit というプラグインが担当している。
補足
スケジューリング時の「実際のリソース使用量」の評価
おそらく、スケジューリング時には「実際のリソース使用量」の評価をしてないのでそれを確認してみる。
例えば物理メモリが約 4 GB、Allocatable なメモリが約 3.9 GB のノードがあり、そのうち約 3.5 GB が実際に使用済みだとする。
$ kubectl top node worker1
NAME     CPU(cores)   CPU%   MEMORY(bytes)   MEMORY%
worker1  20m          1%     3554Mi          92%

$ kubectl top pod
NAME     CPU(cores)   MEMORY(bytes)
stress   0m           3207Mi
逆に、 Allocated resources は大きく空いているとする。
Allocated resources:
  (Total limits may be over 100 percent, i.e., overcommitted.)
  Resource           Requests     Limits
  --------           --------     ------
  cpu                300m (15%)   0 (0%)
  memory             500Mi (13%)  0 (0%)
この時、物理メモリ量を超える(そして Allocated resources が 100% を超えない範囲の) Memory Request = 2000Mi を持つ Pod をデプロイできる。
- デプロイ後、Allocated resources は単純に 2000Mi 加算される。
Allocated resources:
  (Total limits may be over 100 percent, i.e., overcommitted.)
  Resource           Requests      Limits
  --------           --------      ------
  cpu                300m (15%)    0 (0%)
  memory             2500Mi (65%)  0 (0%)  # 500Mi → 2500Mi になった
- ただし、実際の使用量はほとんど変わらず(nginx の Pod なので)
kubectl top node worker1
NAME      CPU(cores)   CPU%   MEMORY(bytes)   MEMORY%
worker1   24m          1%     3564Mi          93%      # 3554Mi → 3564Mi になっただけ

$ kubectl top pod
NAME     CPU(cores)   MEMORY(bytes)
nginx    4m           7Mi
stress   0m           3207Mi
もしかしたら、スケジューリングのスコア付けの際に「実際のリソース使用量」を評価するのかもしれないが、少なくともそれによりデプロイ自体を拒否されることはない。
スケジューラーの Binding Cycle について
スケジューラーは Scheduling Cycle で Pod を実行するノードを決定すると、Binding Cycle でそれを Pod リソースに反映する。Binding Cycle は端的に言うと、決定したノード名を Pod の nodeName にセットして Pod リソースを更新する。
$ kubectl get pod nginx -o yaml
apiVersion: v1
kind: Pod
metadata:
  name: nginx
  namespace: default
spec:
  containers:
  - image: nginx
    name: nginx
  nodeName: worker1  # ここにノード名がセットされる
  // ...
この更新は、Kubernetes API 的には pods のサブリソースである binding に POST を発行することで行われる。
POST https://10.0.0.11:6443/api/v1/namespaces/default/pods/nginx/binding
ただ、この API は Kubernetes APIリファレンス v1.25 にも記載が無いようで、Github に Issue Document pod/binding endpoint in API referenceが発行されていた(Close されてるが修正はされてない)。
API のソース的には以下の箇所になる。
- API パス
pods/<Pod名>/bindingを処理する構造体 BindingREST をセット (kubernetes/pkg/registry/core/rest/storage_core.go)
	storage := map[string]rest.Storage{}
	if resource := "pods"; apiResourceConfigSource.ResourceEnabled(corev1.SchemeGroupVersion.WithResource(resource)) {
		// ...
		storage[resource+"/binding"] = podStorage.Binding
- BindingREST の実装で Pod の Spec にノード名を割り当てている箇所 (kubernetes/pkg/registry/core/pod/storage/storage.go)
// BindingREST implements the REST endpoint for binding pods to nodes when etcd is in use.
type BindingREST struct {
	store *genericregistry.Store
}

// assignPod assigns the given pod to the given machine.
func (r *BindingREST) assignPod(ctx context.Context, podUID types.UID, podResourceVersion, podID string, machine string, annotations map[string]string, dryRun bool) (err error) {
	if _, err = r.setPodHostAndAnnotations(ctx, podUID, podResourceVersion, podID, machine, annotations, dryRun); err != nil {
		// ...
	}
	return
}

// setPodHostAndAnnotations sets the given pod's host to 'machine' if and only if
// the pod is unassigned and merges the provided annotations with those of the pod.
// Returns the current state of the pod, or an error.
func (r *BindingREST) setPodHostAndAnnotations(ctx context.Context, podUID types.UID, podResourceVersion, podID, machine string, annotations map[string]string, dryRun bool) (finalPod *api.Pod, err error) {
	podKey, err := r.store.KeyFunc(ctx, podID)
    // ...
	err = r.store.Storage.GuaranteedUpdate(ctx, podKey, &api.Pod{}, false, preconditions, storage.SimpleUpdate(func(obj runtime.Object) (runtime.Object, error) {
		pod, ok := obj.(*api.Pod)
		// ...
		if pod.Spec.NodeName != "" {
			return nil, fmt.Errorf("pod %v is already assigned to node %q", pod.Name, pod.Spec.NodeName)
		}
		pod.Spec.NodeName = machine // ★ノード名をセット
        // ...
		finalPod = pod
		return pod, nil
	}), dryRun, nil)
	return finalPod, err
}
参考資料
- https://kubernetes.io/docs/concepts/configuration/manage-resources-containers/
- https://kubernetes.io/docs/concepts/scheduling-eviction/scheduling-framework/
- https://kubernetes.io/docs/tasks/administer-cluster/reserve-compute-resources/
- https://kubernetes.io/docs/reference/scheduling/config/
- https://kubernetes.io/docs/concepts/scheduling-eviction/node-pressure-eviction/
- https://kops.sigs.k8s.io/node_resource_handling/
- https://stackoverflow.com/questions/71026204/k8s-node-allocatable-not-taking-in-account-pod-resources