shapefileを入手する
以下のような場所からライセンス的にも使い勝手の良いシェープファイルが入手できる。
- 国土数値情報 行政区域データの詳細
-
政府統計の総合窓口
- 「地図で見る > 境界データダウンロード」から検索してダウンロード
- 例では「境界データ > 小地域 > 国勢調査 > 2015年 > 小地域(町丁・字等別) > 世界測地系緯度経度・Shape形式 > 新潟県」と辿ってダウンロードしたファイルを使用している。
今回はe-statのものを利用した。以下では、シェープファイルがshpディレクトリ以下に展開してあることを想定している。
必要パッケージ
sfと開発版のggplot2を使う。ggplot2開発版にはsfオブジェクトのためのgeom_sf等が入っている。
devtools::install_github("tidyverse/ggplot2")
install.packages("sf")
install.packages("dplyr") # 記事後半の領域結合で使った
library(ggplot2)
library(sf)
library(dplyr)
シェープファイル読み込み
map <- read_sf("shp/h27ka15103.shp") # 中央区のシェープファイル
プロット
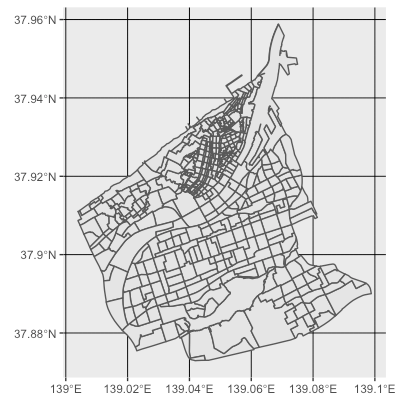
geom_sfだけで最低限の描画ができる。
ggplot(map) + geom_sf()
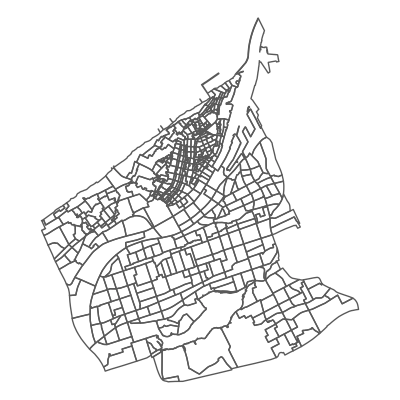
余分なものは以下のように削除する。
ggplot(map) +
  geom_sf(fill = NA) +   # 塗りつぶしの削除
  coord_sf(datum = NA) + # グリッドの削除
  theme_void()           # 軸・背景色の削除
その他の操作
領域を結合したい
st_unionで結合してしまうとggplotに渡せなくなってしまうのでsfオブジェクトに再度変換して...とか思ってたら@yutannihilationさんに良い方法を教えて頂いた。
こういうときはsummarise()が便利かもしれません。 https://t.co/qBmx0928QS
— Hiroaki Yutani (@yutannihilation) 2018年2月23日
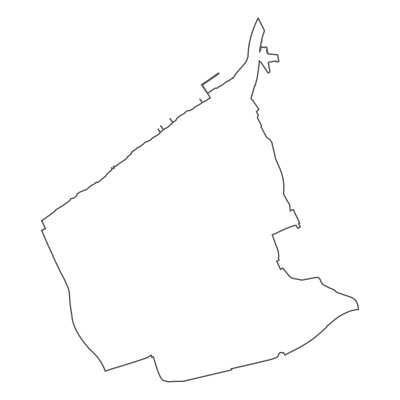
summarizeに渡すだけでポリゴン部分は結合されるので、適当にダミーの集計項目を渡してやれば良い。
map %>% summarize("") %>%
  ggplot() +
  geom_sf(fill = NA) +
  coord_sf(datum = NA) +
  theme_void()
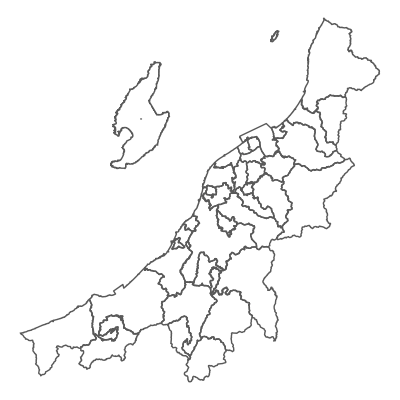
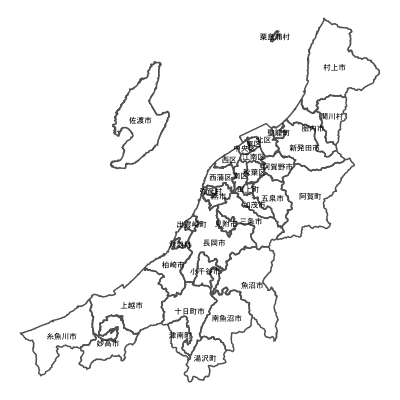
たとえばgroup_byと組み合わせて県域データを市区町村別にまとめるなんてこともできる。
map2 <- read_sf("shp/h27ka15.shp") # 新潟県全域のデータ

map2 %>%
  group_by(CITY_NAME) %>%
  summarize("") %>%
  ggplot() +
  geom_sf(fill = NA) +
  coord_sf(datum = NA) +
  theme_void()
svgで出力したい
ggsaveでdevice="svg"を指定すればsvgできれいに出力できる。(svgliteのインストールが必要な場合がある。)
p <- ggplot(map) +  # オブジェクトに格納
  geom_sf(fill = NA) +   # 塗りつぶしの削除
  coord_sf(datum = NA) + # グリッドの削除
  theme_void()           # 軸・背景色の削除

# install.packages("svglite")
ggsave(p, filename = "niigata.svg", device = "svg")
市名とかを書き込みたい
今回使用した県域のデータh27ka15.shpではCITY_NAMEに市名が格納されている。
geom_sfを使ってテキストも書けると楽なんだけど、多分実装されない(cf. stat_sf(geom = "text") · Issue #2111 · tidyverse/ggplot2)ので、x座標とy座標を抽出してgeom_textに渡してやる。
もしデータ内に既に代表になりそうな点の情報が含まれていれば(そういう場合は多い)、それを使用して
geom_text(aes(x = x座標, y = y座標, label = 書き込みたいラベル列))
などとやってやればよいが(※さらに環境によってはfamily=でフォントを指定しないと文字化けする場合がある)、入っていない場合、あるいは例えば領域の結合などの操作を行った場合には自分で書き込み位置を指定しなければならない。今回は書き込み位置は領域の重心とする。重心の計算はst_centroidで、計算結果からの座標値抽出はst_coordinatesで行う。
以下に県域データを市単位でまとめ、市名を書き込む例を示す。
map2 %>%
  group_by(CITY_NAME) %>% # 市名でグルーピング
  summarize("") %>% # グループ単位で領域結合
  mutate( # 重心計算と座標値の抽出
    centroid = st_centroid(geometry),
    x = st_coordinates(centroid)[, 1],
    y = st_coordinates(centroid)[, 2]
  ) %>%
  ggplot() +
  geom_sf(fill = NA) +
  geom_text(aes(x = x, y = y, label = CITY_NAME),
            family = "Osaka", size = 2) + # mac向けフォント指定
  coord_sf(datum = NA) +
  theme_void()
