2軸プロットが欲しくなるとき
y軸が左右にあるいわゆる2軸プロットはExcelなんかでは簡単に作れるがggplot2では簡単には作れない。
つまりそもそもそんなもん作るなという話だが、欲しくなる場面はある。
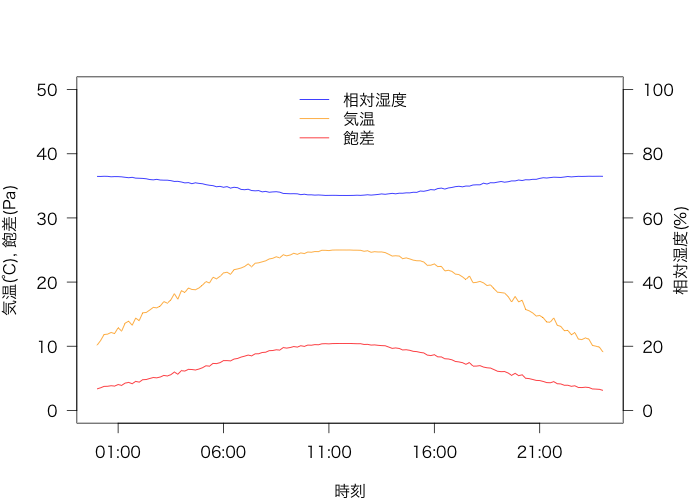
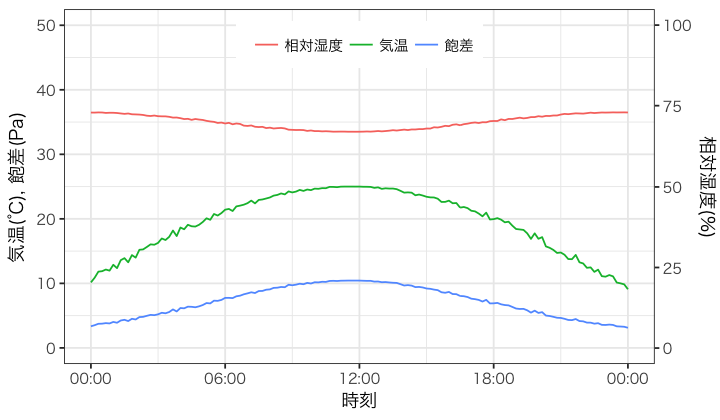
例として気温(℃)と相対湿度(%)と飽差(Pa)をプロットする場合を挙げよう。飽差は気温と相対湿度から算出できる数値で、「乾きやすさ」の指標と考えてもらえればいい。
日常的な環境では、3つの変数のうち相対湿度が最も大きく変動するので、これらを1枚に収めると相対湿度の変動だけが目立ってしまう。したがって、相対湿度だけ第2軸に移してなんとかしたい、という動機が生ずる。
使用データ
上述の気温、相対湿度、飽差をプロットする例を想定し、次のように作成した。
## function ----
svp <- function(t){ # 飽和水蒸気圧計算 Alduchov and Eskridge(1996)
  ifelse(t > 0,
         6.1094 * exp(17.625 * t / (243.04 + t)),
         6.1121 * exp(22.587 * t / (273.86 + t)))
}
vpd <- function(t, RH){ #飽差(VPD:水蒸気分圧差)
  svp(t) * (1 - RH/100)
}

## data ----
start <- as.POSIXct("2017/1/1")
end <- as.POSIXct("2017/1/2")
Time <- seq(start, end, by = "10 min") # 時間
Temp <- sin(seq(0, pi, len = length(Time)) + runif(length(Time)) * 0.1) * 15 + 10 # 気温
RH <- cos(seq(0, 2*pi, len = length(Time)) + runif(length(Time))*0.2) * 3 + 70    # 相対湿度
VPD <- vpd(Temp, RH) # 飽差(VPD)
Timeをx軸として、Temp、RH、VPDをプロットしていくようなことを考える。
まずはbaseで作図
baseパッケージ上でやる場合は、プロットの間にpar(new=TRUE)を挟んで重ね描きしていけば良い。
par(mar=c(4, 4, 4, 4))
plot(Time, RH, type = "l", ylim = c(0, 100), axes = FALSE, col = "blue",
     ylab = "", xlab = "時刻") # 枠なし軸なし
axis(4, las = 1)               # 右側に軸を書く
mtext("相対湿度(%)", 4, 2.5)   # 右側の外(margin)にラベルを書く
par(new=TRUE) # 上書きON
plot(Time, Temp, type = "l", ylim = c(0, 50), col = "orange",
     ylab = "気温(℃), 飽差(Pa)", xlab = "", las = 1)
points(Time, VPD, type = "l", col = "red") # 同じ軸を使う場合はpoints()で良い
legend("top", inset = 0.01,
       legend = c("相対湿度", "気温", "飽差"),
       lty = 1,
       col = c("blue", "orange", "red"),
       box.lty = 0)
ポイントは一気にやろうとしないことだ。
最初は非表示項目を多くしておいて、少しずつ手作業で重ねていく。
結果として、あとで細かい調整をしようとすると大変面倒くさい。
ggplot2でやる
データを整形する
ggplot2でやる場合は先にデータを整形しておく。
library(ggplot2)
library(dplyr)
library(tidyr)
second_rate = 0.5 # 主軸に対する第2軸の倍率
df <-
  data.frame(Time, Temp, RH = RH * second_rate, VPD) %>%
  gather(key = param, value = val, -Time)
この時、第2軸に持っていきたいデータは第2軸に対応するように値を変換しておく。ここではRHを第2軸として「低く」したいので0.5倍している。
プロットする
ggplot2 2.2.0から第2軸を作成できるようになっている。
ggplot(df, aes(x = Time, y = val, col = param)) +
  geom_line() +
  scale_y_continuous(
    limits = c(0, 50),
    sec.axis = sec_axis(~ . / second_rate, name = "相対湿度(%)")
  ) +
  labs(x = "時刻", y = "気温(℃), 飽差(Pa)") +
  scale_color_hue(name = "", label = c("相対湿度", "気温", "飽差")) +
  scale_x_datetime(date_labels = "%H:%M") +
  theme_bw(base_family = "HiraKakuProN-W3") + # mac用フォント指定
  theme(legend.position = c(0.5, 0.9),
        legend.direction = "horizontal")
第2軸はscale_y_...でsec.axis=に指定する。
ここではパラメータの指定にsec_axis()を使っているが、第1軸の設定値をそのまま使いたいような場合はdup_axis()を使うこともできる。いずれも第1引数に第1軸から第2軸の値への変換方法をモデル式で記述する。
注意しなければならないのは、sec.axis=への指定は単に軸を作るだけという点だ。すべての値はあくまで第1軸を基準としてプロットされる。今回の例のように第2軸に対応する値のプロット位置も変えたい場合は、値の変換ルールと軸の変換ルールが対応するようにする必要がある。

