はじめに
PrometheusとGrafanaによる監視システムを構築してみるメモ


aptによるインストールではなく、圧縮ファイルから展開して構築
とりあえずの監視対象は、prometheusの実行ホスト自体を登録
環境
- Proxmox VE 8.3上のUbuntu24.04に構築
$ uname -a
Linux prom 6.8.0-55-generic #57-Ubuntu SMP PREEMPT_DYNAMIC Wed Feb 12 23:42:21 UTC 2025 x86_64 x86_64 x86_64 GNU/Linux
$ cat /etc/lsb-release
DISTRIB_ID=Ubuntu
DISTRIB_RELEASE=24.04
DISTRIB_CODENAME=noble
DISTRIB_DESCRIPTION="Ubuntu 24.04.2 LTS"
$ cat /etc/os-release
PRETTY_NAME="Ubuntu 24.04.2 LTS"
NAME="Ubuntu"
VERSION_ID="24.04"
VERSION="24.04.2 LTS (Noble Numbat)"
VERSION_CODENAME=noble
ID=ubuntu
ID_LIKE=debian
HOME_URL="https://www.ubuntu.com/"
SUPPORT_URL="https://help.ubuntu.com/"
BUG_REPORT_URL="https://bugs.launchpad.net/ubuntu/"
PRIVACY_POLICY_URL="https://www.ubuntu.com/legal/terms-and-policies/privacy-policy"
UBUNTU_CODENAME=noble
LOGO=ubuntu-logo
構築手順
-
Prometheus
- ユーザとディレクトリの作成
- ダウンロードと展開
- 設定ファイルの修正
- サービス化
- 動作確認
-
NodeExporter
- ダウンロードと展開
- サービス化
- 動作確認
-
Grafana
- ユーザとディレクトリの作成
- ダウンロードと展開
- サービス化
- 動作確認
Prometheus
ユーザとディレクトリの作成
$ sudo useradd --no-create-home --shell /bin/false prometheus
$ sudo mkdir /etc/prometheus
$ sudo mkdir /var/lib/prometheus
ダウンロードと展開
ダウンロードパスは、Prometheus公式のダウンロードセクション から取得
$ wget https://github.com/prometheus/prometheus/releases/download/v3.2.1/prometheus-3.2.1.linux-amd64.tar.gz
$ tar xvf prometheus-3.2.1.linux-amd64.tar.gz
$ cd prometheus-3.2.1.linux-amd64
$ sudo mv prometheus /usr/local/bin/
$ sudo mv promtool /usr/local/bin/
$ sudo mv prometheus.yml /etc/prometheus/
$ sudo chown -R prometheus:prometheus /etc/prometheus
$ sudo chown -R prometheus:prometheus /var/lib/prometheus
設定ファイルの修正
sudo vim /etc/prometheus/prometheus.yml を修正
job_name を node に変更する
/etc/prometheus/prometheus.yml
scrape_configs:
  # The job name is added as a label `job=<job_name>` to any timeseries scraped from this config.
  #  - job_name: "prometheus"
  #
  #    # metrics_path defaults to '/metrics'
  #    # scheme defaults to 'http'.
  #
  #    static_configs:
  #      - targets: ["localhost:9090"]

  - job_name: 'node'
    static_configs:
      - targets: ['localhost:9100']
サービス化
$ cat <<EOF | sudo tee /etc/systemd/system/prometheus.service
[Unit]
Description=Prometheus
Wants=network-online.target
After=network-online.target

[Service]
User=prometheus
Group=prometheus
Type=simple
ExecStart=/usr/local/bin/prometheus   --config.file=/etc/prometheus/prometheus.yml   --storage.tsdb.path=/var/lib/prometheus   --web.listen-address="0.0.0.0:9090"

[Install]
WantedBy=multi-user.target
EOF

$ sudo systemctl daemon-reload
$ sudo systemctl enable --now prometheus
動作確認
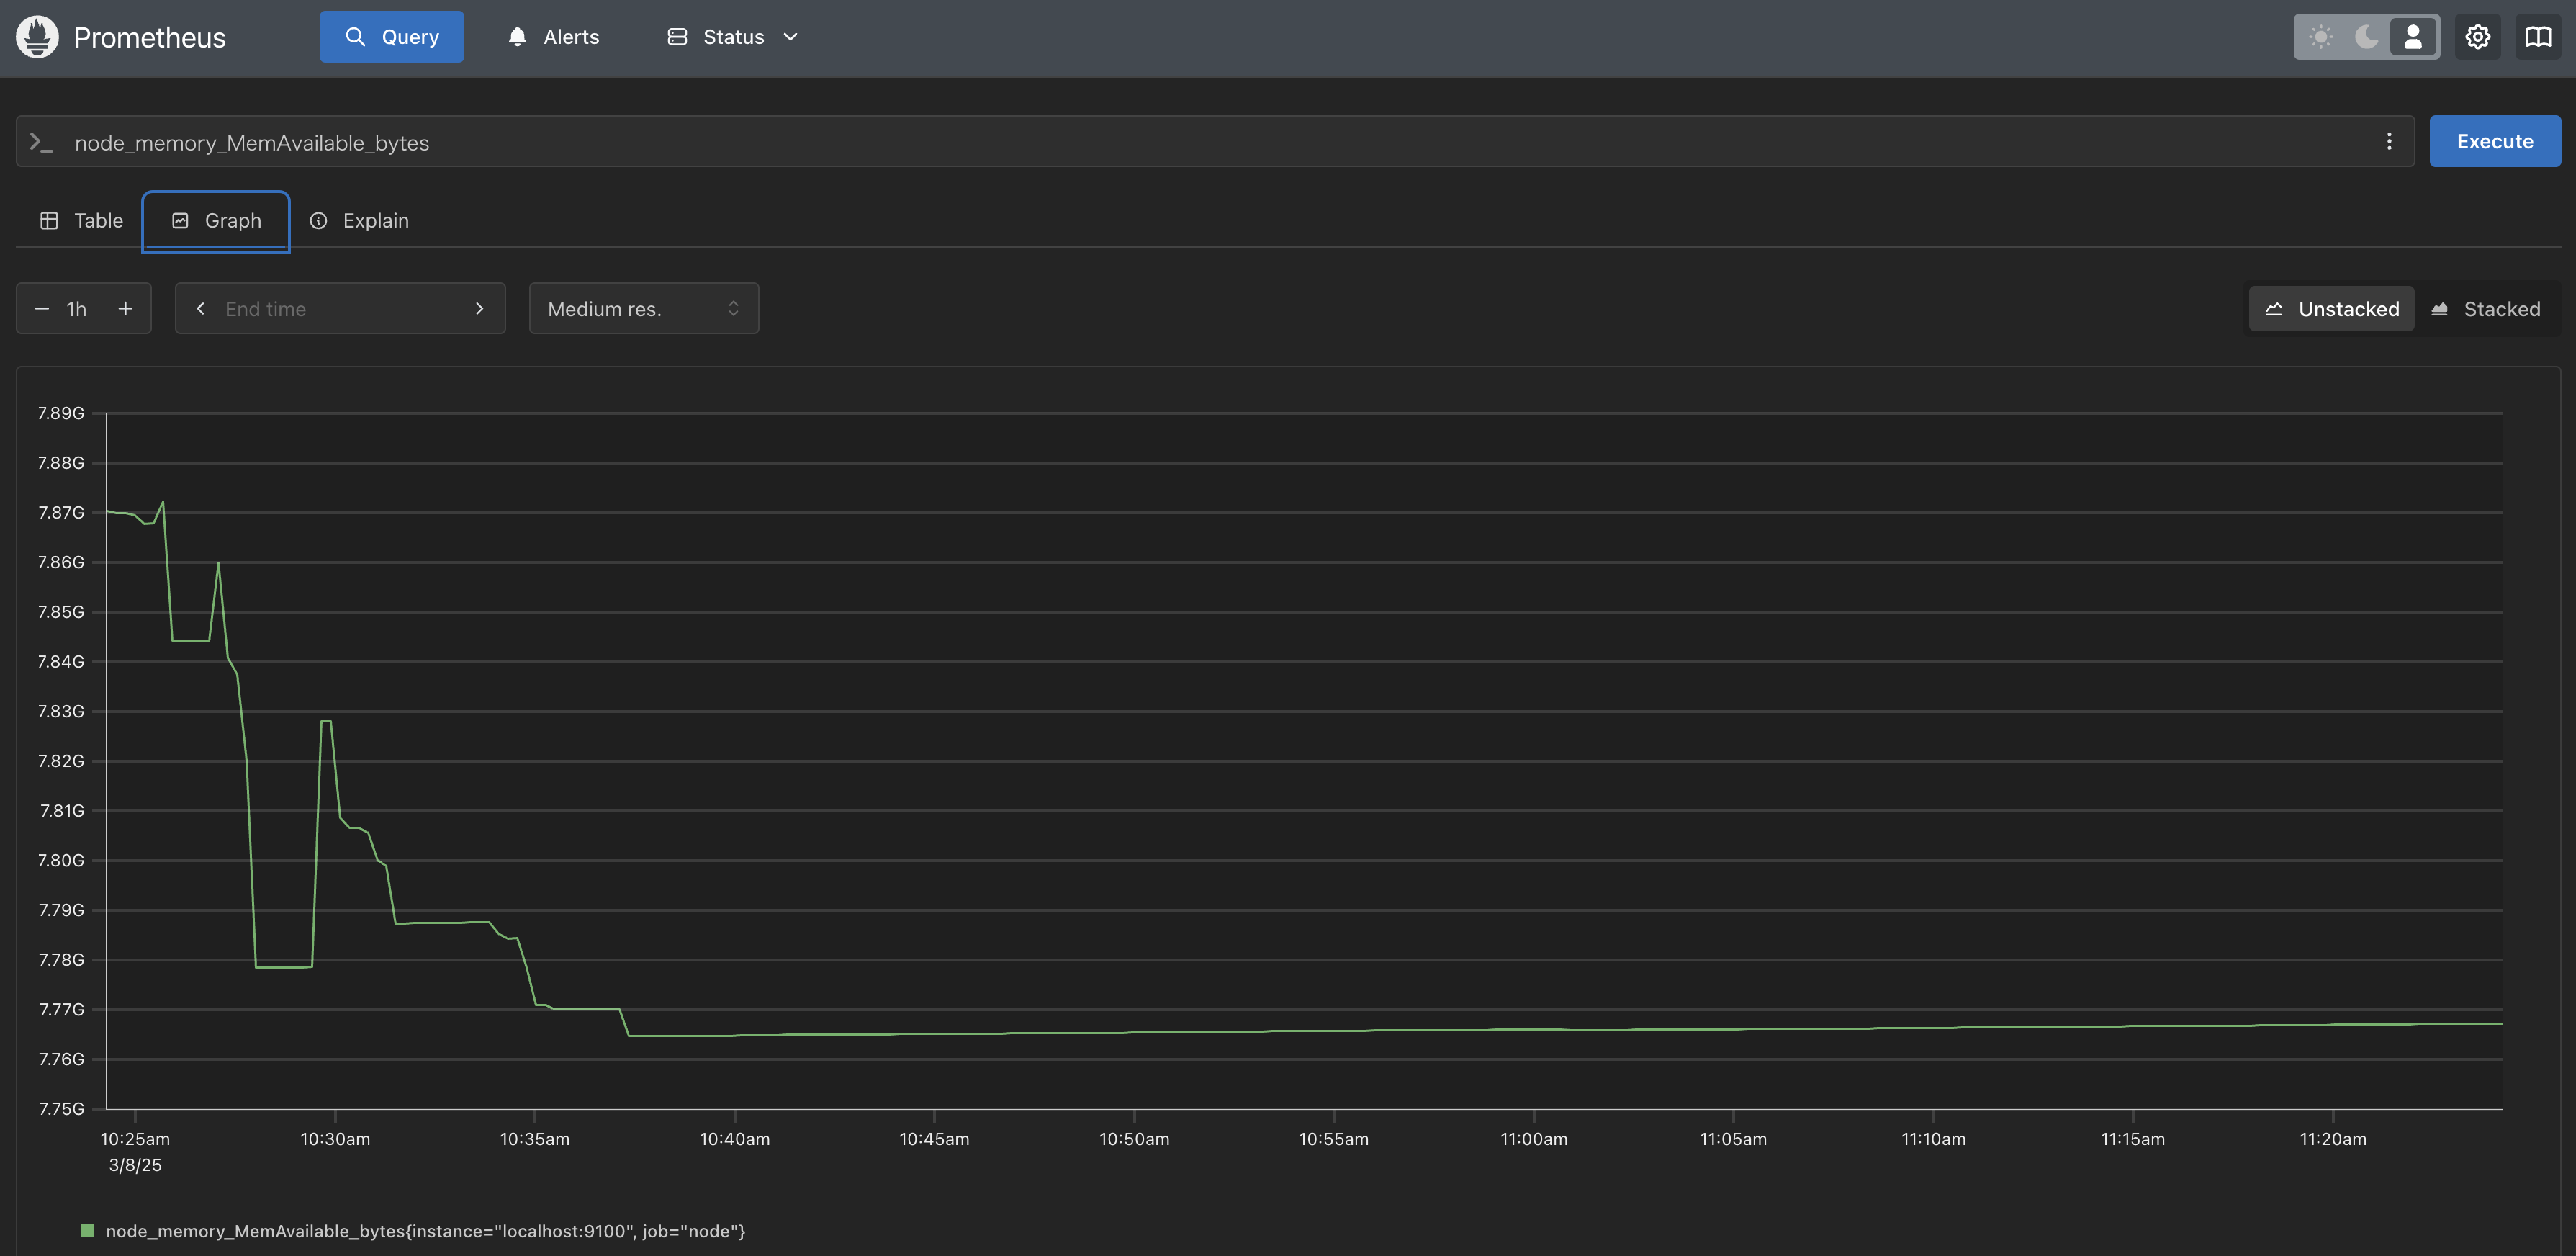
http://{ホストのIP}:9090/ にアクセスして、画面が表示されることを確認。

NodeExporter
ダウンロードと展開
ダウンロードパスは、Prometheus公式のダウンロードセクション から取得
$ wget https://github.com/prometheus/node_exporter/releases/download/v1.9.0/node_exporter-1.9.0.linux-amd64.tar.gz
$ tar xvfz node_exporter-1.9.0.linux-amd64.tar.gz
$ cd node_exporter-1.9.0.linux-amd64
$ sudo mv node_exporter /usr/local/bin/
サービス化
$ cat <<EOF | sudo tee /etc/systemd/system/node_exporter.service
[Unit]
Description=Node Exporter
After=network.target

[Service]
User=prometheus
Group=prometheus
Type=simple
ExecStart=/usr/local/bin/node_exporter

[Install]
WantedBy=multi-user.target
EOF

$ sudo systemctl daemon-reload
$ sudo systemctl enable --now node_exporter
動作確認
http://{ホストのIP}:9090/ の Status → Target health に Endpoint として http://localhost:9100/metrics が登録されていることを確認。

Grafana
ユーザとディレクトリの作成
$ sudo useradd --no-create-home --system --shell /bin/false grafana
$ sudo mkdir /usr/local/grafana
ダウンロードと展開
ダウンロードパスは、Grafana公式のダウンロードセクション から取得
$ wget https://dl.grafana.com/oss/release/grafana-11.5.2.linux-amd64.tar.gz
$ tar -zxvf grafana-11.5.2.linux-amd64.tar.gz
$ sudo mv grafana-v11.5.2 /usr/local/grafana
$ sudo chown -R grafana:grafana /usr/local/grafana
サービス化
$ cat <<EOF | sudo tee /etc/systemd/system/grafana.service
[Unit]
Description=Grafana
After=network.target

[Service]
User=root
Group=root
Type=simple
ExecStart=/usr/local/grafana/bin/grafana server --homepath /usr/local/grafana --config /usr/local/grafana/conf/defaults.ini

[Install]
WantedBy=multi-user.target
EOF

$ sudo systemctl daemon-reload
$ sudo systemctl enable --now grafana
動作確認
http://{ホストのIP}:3000/ にアクセスして、画面が表示されることを確認。

さいごに
かんたんでしたね