Auto Encoderで再生した画像をMSE,binary_crossentropy,PSNRで評価
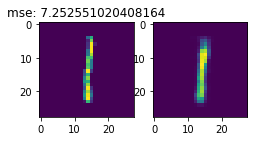
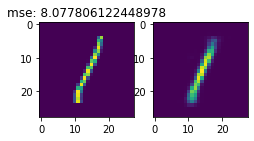
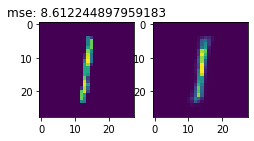
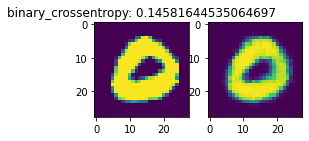
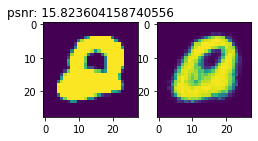
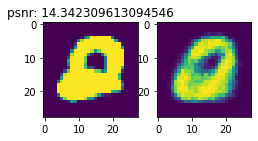
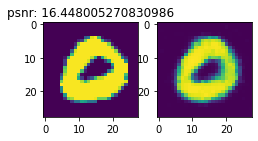
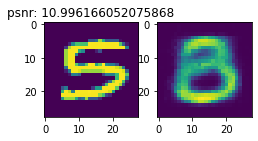
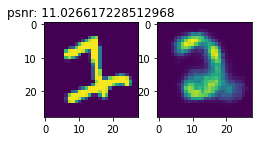
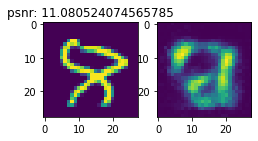
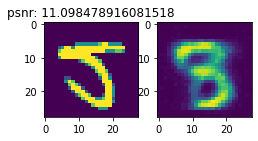
AutoEncoderで再生した画像をMSE,binary_crossentropy,PSNRで評価し、
上位10個、下位10個を表示して確認すした。
やはり、直感的にはMSEが一番わかりやすい。
binary_crossentropyは元のアタイの範囲を0~1になるように1/2555にする前処理が必要。
import keras
from keras.datasets import mnist
import matplotlib.pyplot as plt
import numpy as np
import pandas as pd
import cv2
%matplotlib inline
Using TensorFlow backend.
from keras import losses
# MSE
from sklearn.metrics import mean_absolute_error

orgs = []
gens = []
binary_crossentropys = np.zeros((4 * 6000),np.float)
mses = np.zeros((4 * 6000),np.float)
psnrs = np.zeros((4 * 6000),np.float)
for i in range(4):
    for j in range(6000):
        index = i*6000 + j
        org = cv2.imread(f'images/org_{i}_{j}.png', cv2.IMREAD_GRAYSCALE)
        gen = cv2.imread(f'images/gen_{i}_{j}.png', cv2.IMREAD_GRAYSCALE)
        orgs.append(org)
        gens.append(gen)
        binary_crossentropys[index] = float(losses.binary_crossentropy(org.reshape(784)/255, gen.reshape(784)/255))
        mses[index] = mean_absolute_error(org, gen)
        psnrs[index] = cv2.PSNR(org, gen)
df = pd.DataFrame({'org': orgs, 'gen': gens, 'binary_crossentropy': binary_crossentropys, 'mse': mses, 'psnr': psnrs})
# MSE
mse_sort = df.sort_values(by='mse', ascending=False)
for i in range(10):
    row = mse_sort.iloc[i]
    mse = row['mse']
    plt.figure(figsize=(20, 20))
    plt.subplot(2,10,i*2+1)
    plt.title(f'mse: {mse}')
    plt.imshow(row['org'])
    plt.subplot(2,10,i*2+2)
    plt.imshow(row['gen'])
    plt.show()
j = 0
for i in range(6000*4-1, 6000*4-11, -1):
    row = mse_sort.iloc[i]
    mse = row['mse']
    plt.figure(figsize=(20, 20))
    plt.subplot(2,10,j*2+1)
    plt.title(f'mse: {mse}')
    plt.imshow(row['org'])
    plt.subplot(2,10,j*2+2)
    plt.imshow(row['gen'])
    plt.show()
    j += 1
# binary_crossentropy
binary_crossentropy_sort = df.sort_values(by='binary_crossentropy', ascending=False)
for i in range(10):
    row = mse_sort.iloc[i]
    mse = row['binary_crossentropy']
    plt.figure(figsize=(20, 20))
    plt.subplot(2,10,i*2+1)
    plt.title(f'binary_crossentropy: {mse}')
    plt.imshow(row['org'])
    plt.subplot(2,10,i*2+2)
    plt.imshow(row['gen'])
    plt.show()
j = 0
for i in range(6000*4-1, 6000*4-11, -1):
    row = binary_crossentropy_sort.iloc[i]
    binary_crossentropy = row['binary_crossentropy']
    plt.figure(figsize=(20, 20))
    plt.subplot(2,10,j*2+1)
    plt.title(f'binary_crossentropy: {binary_crossentropy}')
    plt.imshow(row['org'])
    plt.subplot(2,10,j*2+2)
    plt.imshow(row['gen'])
    plt.show()
    j += 1
# PSNR
psnr_sort = df.sort_values(by='psnr', ascending=False)
for i in range(10):
    row = mse_sort.iloc[i]
    psnr = row['psnr']
    plt.figure(figsize=(20, 20))
    plt.subplot(2,10,i*2+1)
    plt.title(f'psnr: {psnr}')
    plt.imshow(row['org'])
    plt.subplot(2,10,i*2+2)
    plt.imshow(row['gen'])
    plt.show()
j = 0
for i in range(6000*4-1, 6000*4-11, -1):
    row = psnr_sort.iloc[i]
    psnr = row['psnr']
    plt.figure(figsize=(20, 20))
    plt.subplot(2,10,j*2+1)
    plt.title(f'psnr: {psnr}')
    plt.imshow(row['org'])
    plt.subplot(2,10,j*2+2)
    plt.imshow(row['gen'])
    plt.show()
    j += 1


