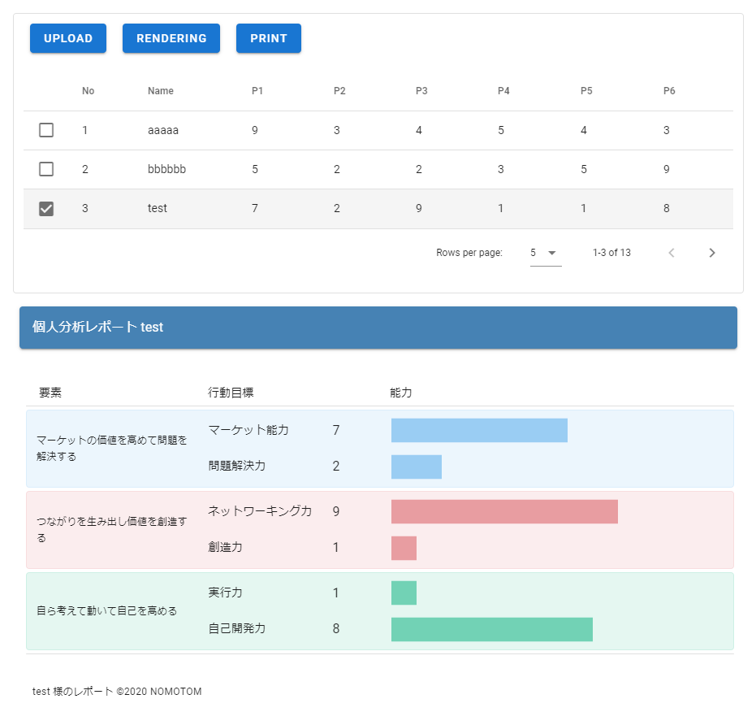
完成イメージ
1.UPLOADボタンからCSVデータをアップロードする。
2.CSVデータがテーブルに表示される。
3.レコードにチェックを入れてレンダリングボタンを押す。
4.CSVデータがレポートエリア(グラフなど)に反映される。
5.PRINTボタンでレポートエリアのみ印刷できる。
動作環境
バージョン情報
node.js
npx nuxt -v
@nuxt./cli v2.14.0
インポートデータ
node.js
npm install vue-json-to-csv
npm install chart.js --save
npm install vue-chartjs --save
pluginフォルダ内にvue-chartjs.jsを作成する
vue-chartjs.js
import Vue from 'vue';
import { HorizontalBar, mixins } from 'vue-chartjs';
const { reactiveProp } = mixins;

Vue.component('horizontalbar-chart', {
  extends: HorizontalBar,
  mixins: [reactiveProp],
  props: {
    options: {
      type: Object,
      default: () => { },
    },
  },
  mounted() {
    this.renderChart(this.chartData, this.options);
  },
});

Vue.component('radar-chart', {
  extends: Radar,
  mixins: [reactiveProp],
  props: {
    options: {
      type: Object,
      default: () => { },
    },
  },
  mounted() {
    this.renderChart(this.radarChartData, this.radarOptions);
  },
});

Vue.component('scatter-chart', {
  extends: Scatter,
  mixins: [reactiveProp],
  props: {
    options: {
      type: Object,
      default: () => { },
    },
  },
  mounted() {
    this.renderChart(this.scatterChartData, this.options);
  },
});
コンセプト
定量的な人事データをグラフ化することで、評価面談や目標設定などの人事活動に活用できるデータを閲覧、レポート化することを前提にしています。
今回のソースコードはそのうちの一部です。
PDFを一括生成にしたら良いんだけどそれはまたの機会に。
やりたいこと
・csvデータを読み込んでテーブル表示する管理画面的な動作
・任意のレコードをチェック→レコードデータがグラフに反映
・レポート用紙として印刷する
内容
上記動作環境のインポートやプラグインファイルの作成を事前に行って、下記ソースコードをコピーして、pagesフォルダ内に置けば、そのままローカル環境ですぐに動作確認できるはずです。
nuxt.js
<template>
<v-container fluid class="pa-0">
<v-flex class="pt-6">
<v-row id="disp">
<v-col cols="12">
<v-card class="pa-3" outlined color="rgbs(245,245,245,1)">
<div>
<input
@change="fileChange"
type="file"
ref="input"
accept="text/csv"
style="display: none"
/>
<v-btn color="primary" class="mx-2" @click="csvUpload">Upload</v-btn>
<v-btn color="primary" class="mx-2" @click="renderingReport">Rendering</v-btn>
<v-btn color="primary" class="mx-2" @click="display()">Print</v-btn>
</div>
<div class="mt-6 mb-2">
<v-data-table
v-model="selected"
:headers="headers"
:items="csvData"
:single-select="singleSelect"
:items-per-page="3"
show-select
item-key="num"
class="elevation-0"
>
<template slot="items" slot-scope="props">
<td class="text-xs-right">{{ props.item.num }}</td>
<td class="text-xs-right">{{ props.item.P1 }}</td>
<td class="text-xs-right">{{ props.item.P2 }}</td>
<td class="text-xs-right">{{ props.item.P3 }}</td>
<td class="text-xs-right">{{ props.item.P4 }}</td>
<td class="text-xs-right">{{ props.item.P5 }}</td>
<td class="text-xs-right">{{ props.item.P6 }}</td>
</template>
</v-data-table>
</div>
</v-card>
</v-col>
</v-row>
<v-container height="1050px" class="ma-0 px-1 py-0">
<v-card class="ma-1" elevation="0">
<v-card class="px-0 py-1" dark color="#4682b4">
<v-card-title class="subtitle-1 pa-2 pl-4">個人分析レポート {{ name }}</v-card-title>
</v-card>
<v-card-text>
<v-row>
<v-col cols="12" class="pl-1 pr-0">
<!-- Row1-title -->
<v-card class="py-3" elevation="0">
<v-row>
<v-col cols="3" class="py-1">
<span class="subtitle-2 px-4">要素</span>
</v-col>
<v-col cols="3" class="py-1">
<span class="subtitle-2">行動目標</span>
</v-col>
<v-col cols="6" class="py-1">
<span class="subtitle-2">能力</span>
</v-col>
</v-row>
<v-divider></v-divider>
<!-- Row1-content1-->
<v-card elevation="0">
<v-card
v-for="(item, i) in row11Items"
:key="i"
class="my-1"
:color="row11Items[i].cardColor"
outlined
>
<v-row class="align-center">
<v-col cols="3" class="pl-3 pr-1">
<v-card-text class="caption pl-3 pr-0 py-0">{{ row11Items[i].element }}</v-card-text>
</v-col>
<v-col cols="3" class="px-0 py-2">
<v-row class="pb-2" align="center">
<v-col cols="8" class="py-0">
<v-card-text
class="body-2 pl-3 pr-0 py-0"
>{{ row11Items[i].actionTarget[0] }}</v-card-text>
</v-col>
<v-col cols="3" class="py-0">
<v-card
class="subtitle-1"
color="rgba(71,164,233,0)"
width="31px"
elevation="0"
>{{ row11Items[i].sten[0] }}</v-card>
</v-col>
</v-row>
<v-row class="pt-2" align="center">
<v-col cols="8" class="py-0">
<v-card-text
class="body-2 pl-3 pr-0 py-0"
>{{ row11Items[i].actionTarget[1] }}</v-card-text>
</v-col>
<v-col cols="3" class="py-0">
<v-card
class="subtitle-1"
color="rgba(71,164,233,0)"
width="31px"
elevation="0"
>{{ row11Items[i].sten[1] }}</v-card>
</v-col>
</v-row>
</v-col>
<v-col cols="4" class="pl-0 py-1">
<v-card-text
class="caption pl-3 pr-1 py-0 mb-1"
v-if="csvData.length != 0"
>
<horizontalbar-chart
id="bars"
:chart-data="chartData1"
:options="chartOptions"
/>
</v-card-text>
<v-card-text
class="caption pl-3 pr-1 py-0 mt-1"
v-if="csvData.length != 0"
>
<horizontalbar-chart
id="bars"
:chart-data="chartData2"
:options="chartOptions"
/>
</v-card-text>
</v-col>
</v-row>
</v-card>
<!-- Row1-content2-->
<v-card
v-for="(item, i) in row12Items"
:key="i"
class="my-1"
:color="row12Items[i].cardColor"
outlined
>
<v-row class="align-center">
<v-col cols="3" class="pl-3 pr-1">
<v-card-text class="caption pl-3 pr-0 py-0">{{ row12Items[i].element }}</v-card-text>
</v-col>
<v-col cols="3" class="px-0 py-2">
<v-row class="pb-2" align="center">
<v-col cols="8" class="py-0">
<v-card-text
class="body-2 pl-3 pr-0 py-0"
>{{ row12Items[i].actionTarget[0] }}</v-card-text>
</v-col>
<v-col cols="3" class="py-0">
<v-card
class="subtitle-1"
color="rgba(71,164,233,0)"
width="31px"
elevation="0"
>{{ row12Items[i].sten[0] }}</v-card>
</v-col>
</v-row>
<v-row class="pt-2" align="center">
<v-col cols="8" class="py-0">
<v-card-text
class="body-2 pl-3 pr-0 py-0"
>{{ row12Items[i].actionTarget[1] }}</v-card-text>
</v-col>
<v-col cols="3" class="py-0">
<v-card
class="subtitle-1"
color="rgba(71,164,233,0)"
width="31px"
elevation="0"
>{{ row12Items[i].sten[1] }}</v-card>
</v-col>
</v-row>
</v-col>
<v-col cols="4" class="pl-0 py-1">
<v-card-text
class="caption pl-3 pr-1 py-0 mb-1"
v-if="csvData.length != 0"
>
<horizontalbar-chart
id="bars"
:chart-data="chartData3"
:options="chartOptions"
/>
</v-card-text>
<v-card-text
class="caption pl-3 pr-1 py-0 mt-1"
v-if="csvData.length != 0"
>
<horizontalbar-chart
id="bars"
:chart-data="chartData4"
:options="chartOptions"
/>
</v-card-text>
</v-col>
</v-row>
</v-card>
<!-- Row1-content3-->
<v-card
v-for="(item, i) in row13Items"
:key="i"
class="my-1"
:color="row13Items[i].cardColor"
outlined
>
<v-row class="align-center">
<v-col cols="3" class="pl-3 pr-1">
<v-card-text class="caption pl-3 pr-0 py-0">{{ row13Items[i].element }}</v-card-text>
</v-col>
<v-col cols="3" class="px-0 py-2">
<v-row class="pb-2" align="center">
<v-col cols="8" class="py-0">
<v-card-text
class="body-2 pl-3 pr-0 py-0"
>{{ row13Items[i].actionTarget[0] }}</v-card-text>
</v-col>
<v-col cols="3" class="py-0">
<v-card
class="subtitle-1"
color="rgba(71,164,233,0)"
width="31px"
elevation="0"
>{{ row13Items[i].sten[0] }}</v-card>
</v-col>
</v-row>
<v-row class="pt-2" align="center">
<v-col cols="8" class="py-0">
<v-card-text
class="body-2 pl-3 pr-0 py-0"
>{{ row13Items[i].actionTarget[1] }}</v-card-text>
</v-col>
<v-col cols="3" class="py-0">
<v-card
class="subtitle-1"
color="rgba(71,164,233,0)"
width="31px"
elevation="0"
>{{ row13Items[i].sten[1] }}</v-card>
</v-col>
</v-row>
</v-col>
<v-col cols="4" class="pl-0 py-1">
<v-card-text
class="caption pl-3 pr-1 py-0 mb-1"
v-if="csvData.length != 0"
>
<horizontalbar-chart
id="bars"
:chart-data="chartData5"
:options="chartOptions"
/>
</v-card-text>
<v-card-text
class="caption pl-3 pr-1 py-0 mt-1"
v-if="csvData.length != 0"
>
<horizontalbar-chart
id="bars"
:chart-data="chartData6"
:options="chartOptions"
/>
</v-card-text>
</v-col>
</v-row>
</v-card>
</v-card>
<v-divider class="mb-4"></v-divider>
</v-card>
</v-col>
</v-row>
</v-card-text>
<v-footer absolute app color="white" class="pb-0">
<span class="caption">{{ name }} 様のレポート ©{{ new Date().getFullYear() }} NOMOTOM</span>
</v-footer>
</v-card>
</v-container>
</v-flex>
</v-container>
</template>
<script>
import VueJsonToCsv from "vue-json-to-csv";
export default {
data: function () {
return {
name: "サンプル太郎",
singleSelect: true,
row11Items: [
{
element: "マーケットの価値を高め果敢に挑戦する",
actionTarget: ["マーケット能力", "問題解決力"],
sten: [10, 5],
cardColor: "rgba(71,164,233,0.1)",
},
],
row12Items: [
{
element: "つながりを活かし、価値を創造する",
actionTarget: ["コミュニケーション力", "適応力"],
sten: [1, 3],
cardColor: "rgba(214,77,84,0.1)",
},
],
row13Items: [
{
element: "自ら考え、動き、変化に対応しながら自己を高めているか。",
actionTarget: ["実行力", "自己開発力"],
sten: [3, 4],
cardColor: "rgba(0,173,121,0.1)",
},
],
selected: [],
labels: {
no: { title: "no" },
name: { title: "Name" },
P1: { title: "P1" },
P2: { title: "P2" },
P3: { title: "P3" },
P4: { title: "P4" },
P5: { title: "P5" },
P6: { title: "P6" },
},
jsonData: [],
headers: [
{ text: "No", align: "left", value: "num", width: "81px" },
{ text: "Name", align: "left", value: "name" },
{ text: "P1", align: "left", value: "P1" },
{ text: "P2", align: "left", value: "P2" },
{ text: "P3", align: "left", value: "P3" },
{ text: "P4", align: "left", value: "P4" },
{ text: "P5", align: "left", value: "P5" },
{ text: "P6", align: "left", value: "P6" },
],
csvData: [],
dataRow: [],
chartDataValues1: "",
chartDataValues2: "",
chartDataValues3: "",
chartDataValues4: "",
chartDataValues5: "",
chartDataValues6: "",
chartColors1t2: "rgba(71,164,233,0.5)",
chartColors3t4: "rgba(214,77,84,0.5)",
chartColors5t6: "rgba(0,173,121,0.5)",
chartLabels1: ["B"],
chartLabels2: ["Bar2"],
chartLabels3: ["Bar3"],
chartLabels4: ["Bar4"],
chartLabels5: ["Bar5"],
chartLabels6: ["Bar6"],
chartOptions: {
responsive: true,
maintainAspectRatio: false,
title: {
display: false,
},
legend: {
display: false,
},
scales: {
yAxes: [
{
display: false,
position: "left",
drawBorder: false,
},
],
xAxes: [
{
display: false,
position: "top",
ticks: {
min: 0,
max: 10,
stepSize: 2,
},
gridLines: {
display: false,
},
},
],
},
},
};
},
components: {
VueJsonToCsv,
},
computed: {
chartData1() {
return {
datasets: [
{
data: this.chartDataValues1,
backgroundColor: this.chartColors1t2,
},
],
labels: this.chartLabels1,
};
},
chartData2() {
return {
datasets: [
{
data: this.chartDataValues2,
backgroundColor: this.chartColors1t2,
},
],
labels: this.chartLabels2,
};
},
chartData3() {
return {
datasets: [
{
data: this.chartDataValues3,
backgroundColor: this.chartColors3t4,
},
],
labels: this.chartLabels3,
};
},
chartData4() {
return {
datasets: [
{
data: this.chartDataValues4,
backgroundColor: this.chartColors3t4,
},
],
labels: this.chartLabels4,
};
},
chartData5() {
return {
datasets: [
{
data: this.chartDataValues5,
backgroundColor: this.chartColors5t6,
},
],
labels: this.chartLabels5,
};
},
chartData6() {
return {
datasets: [
{
data: this.chartDataValues6,
backgroundColor: this.chartColors5t6,
},
],
labels: this.chartLabels6,
};
},
},
methods: {
renderingReport() {
if (this.selected.length != 0) {
console.log(this.selected[0].P1);
this.name = this.selected[0].name;
this.chartDataValues1 = this.selected[0].P1;
this.chartDataValues2 = this.selected[0].P2;
this.chartDataValues3 = this.selected[0].P3;
this.chartDataValues4 = this.selected[0].P4;
this.chartDataValues5 = this.selected[0].P5;
this.chartDataValues6 = this.selected[0].P6;
this.row11Items[0].sten[0] = this.selected[0].P1;
this.row11Items[0].sten[1] = this.selected[0].P2;
this.row12Items[0].sten[0] = this.selected[0].P3;
this.row12Items[0].sten[1] = this.selected[0].P4;
this.row13Items[0].sten[0] = this.selected[0].P5;
this.row13Items[0].sten[1] = this.selected[0].P6;
}
},
display() {
navigator.clipboard.writeText(
this.selected[0].name + ", Personal Analysis Report"
);
document.getElementById("disp").style.display = "none";
window.print();
document.getElementById("disp").style.display = "block";
},
csvUpload() {
this.$refs.input.click();
},
fileChange: function (e) {
const file = e.target.files[0];
const reader = new FileReader();
const csvData = [];
const loadFunc = () => {
const lines = reader.result.split("\n");
console.log(lines);
let i = 0;
lines.forEach((element) => {
if (i == 0) {
console.log("0 row was skipped");
} else {
const csvDataSplit = element.split(",");
const csvDataRow = {
num: csvDataSplit[0],
name: csvDataSplit[1],
P1: csvDataSplit[2],
P2: csvDataSplit[3],
P3: csvDataSplit[4],
P4: csvDataSplit[5],
P5: csvDataSplit[6],
P6: csvDataSplit[7],
};
csvData.push(csvDataRow);
}
i++;
});
this.csvData = csvData;
};
reader.onload = loadFunc;
reader.readAsBinaryString(file);
},
},
};
</script>
<style lang="scss" scoped>
# bars {
width: 330px;
max-height: 41px;
padding-right: 18px;
padding-left: 2px;
}
</style>
個別のメソッドについて
csvUpload()
読み込んだcsvデータをテーブルデータ用の配列変数に格納する。
renderingReport()
csvデータをグラフなどの配列変数に渡す。
display()
レポートエリア以外を非表示にして印刷を実行する。
おわりに
複数機能あるけど動作確認しやすいと思うので好きにいじってくれればいいです。
管理画面作りは楽しい。