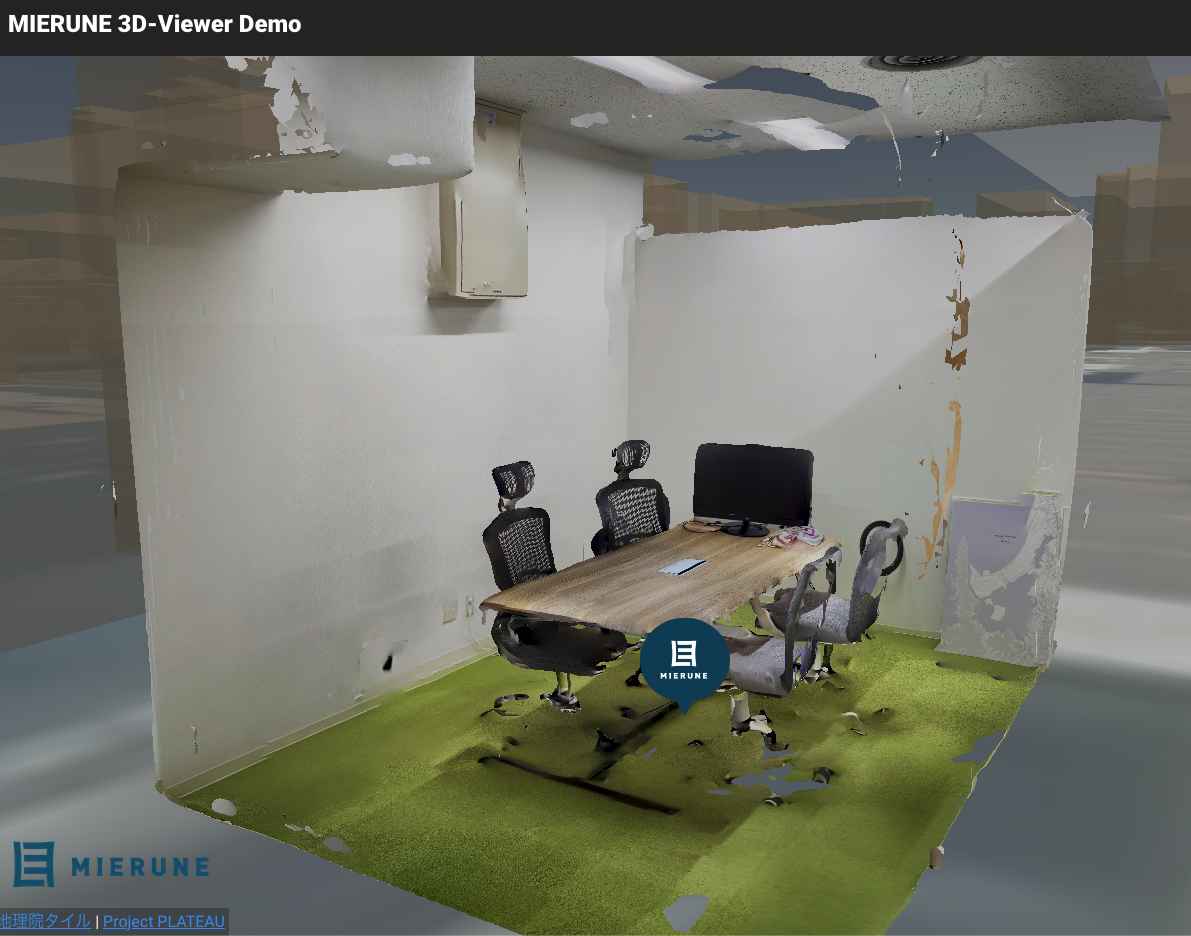
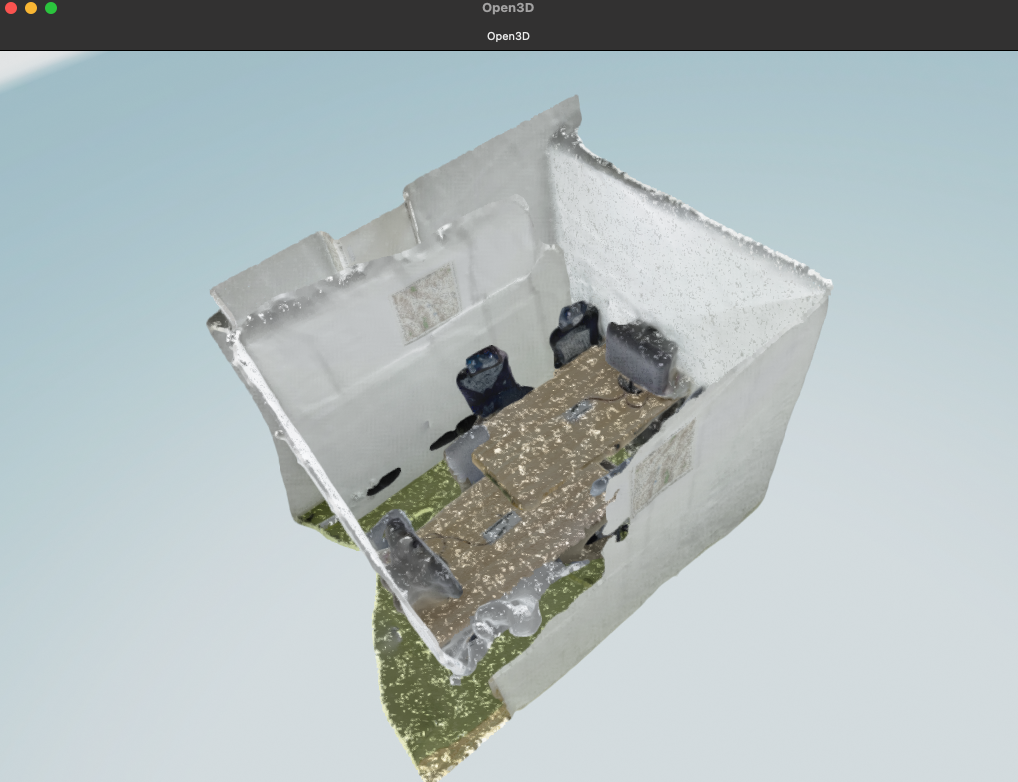
弊社オフィスの会議室は以下のデモサイトで全世界に公開されているんですが、実はこれ、iPhoneのLiDARで撮影した点群データを、CesiumJS上で描画しています。
https://demo-3d.mierune.io/
これは一回で頑張って撮影したんですが、広い範囲を撮影する場合は、どうしても複数回に分けて撮影する必要があったりします。
複数のデータを結合する際にはCloudCompareなどのGUIツールを利用するのが一般的ですが、細かい調整や自動化・システムへの取り込みなどを行おうとすると、どうしてもプログラムを組まなければならないタイミングが出てきます。
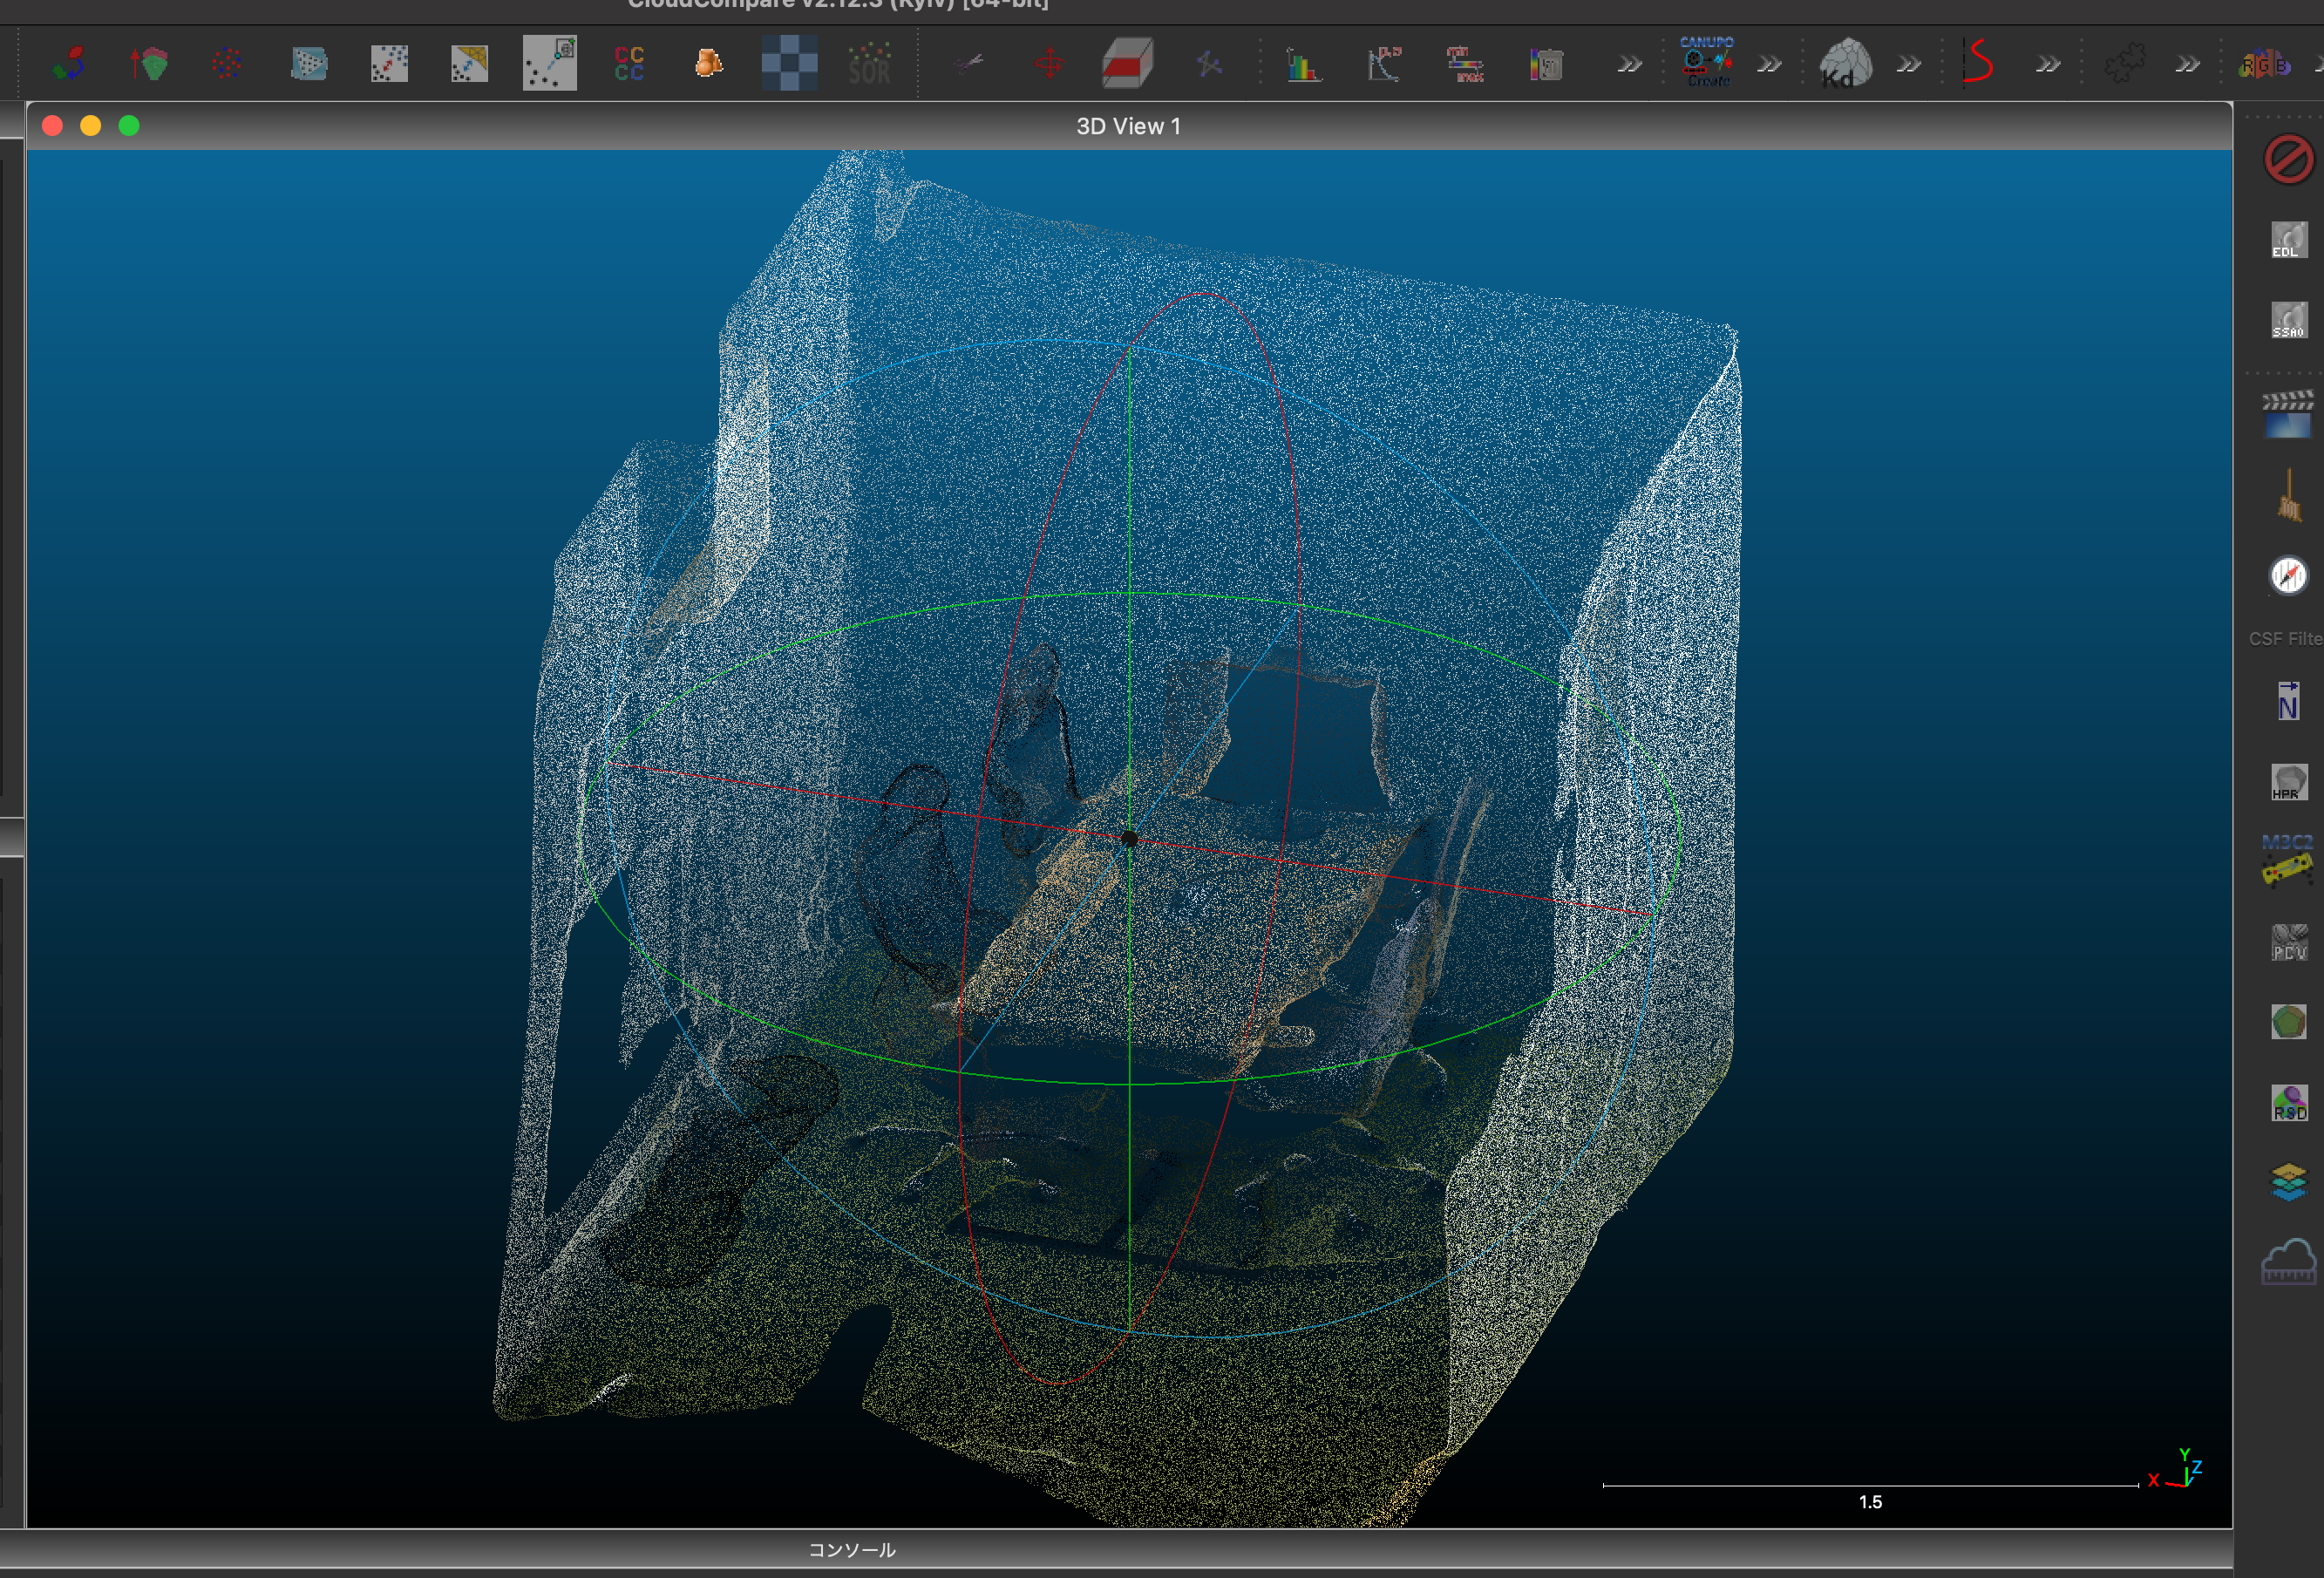
(CloudCompareで点群データを表示)
今回は、Pythonを利用して、以下の作業を行なっていきたいと思います。
データの確認
Polycamというアプリを使用して点群データを取得しましたが、Polycamはさまざまなデータ形式で点群データを出力することができますが、今回はplyという一般的な点群データ形式で出力しました。
今回は同じ部屋を3パターンに分けて撮影したため、それぞれroom1.ply・room2.plyのようにリネームしておきます。
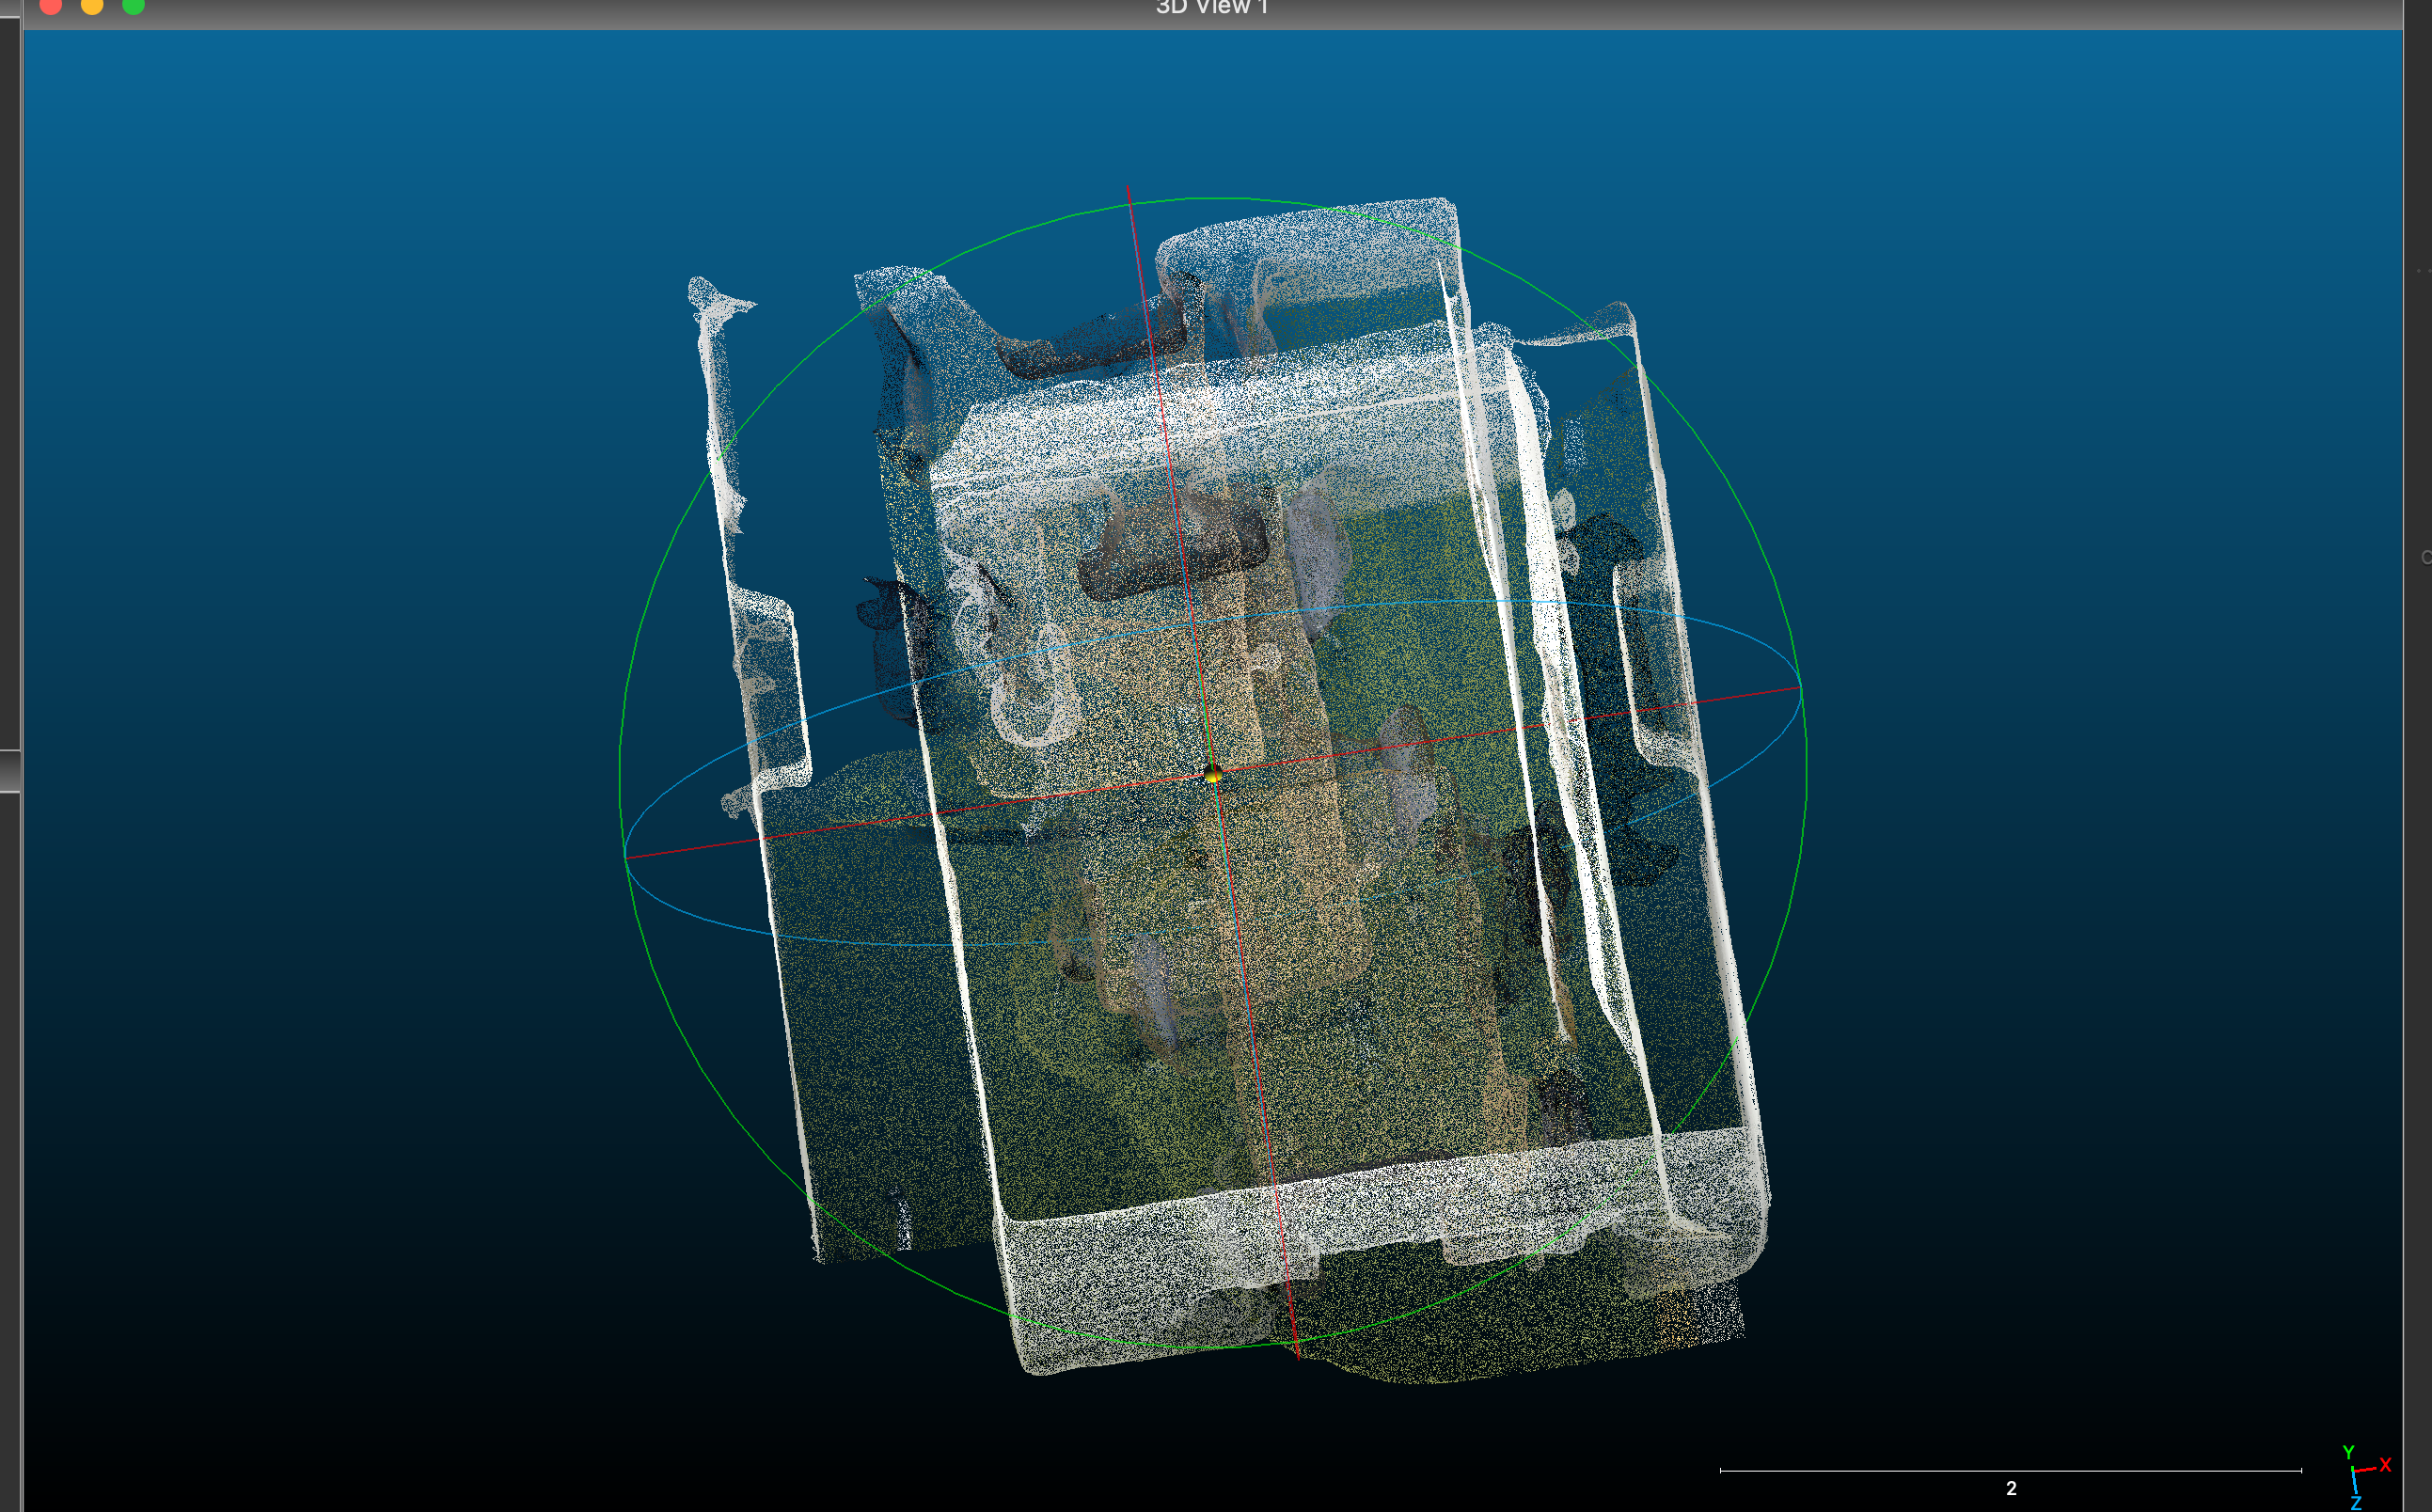
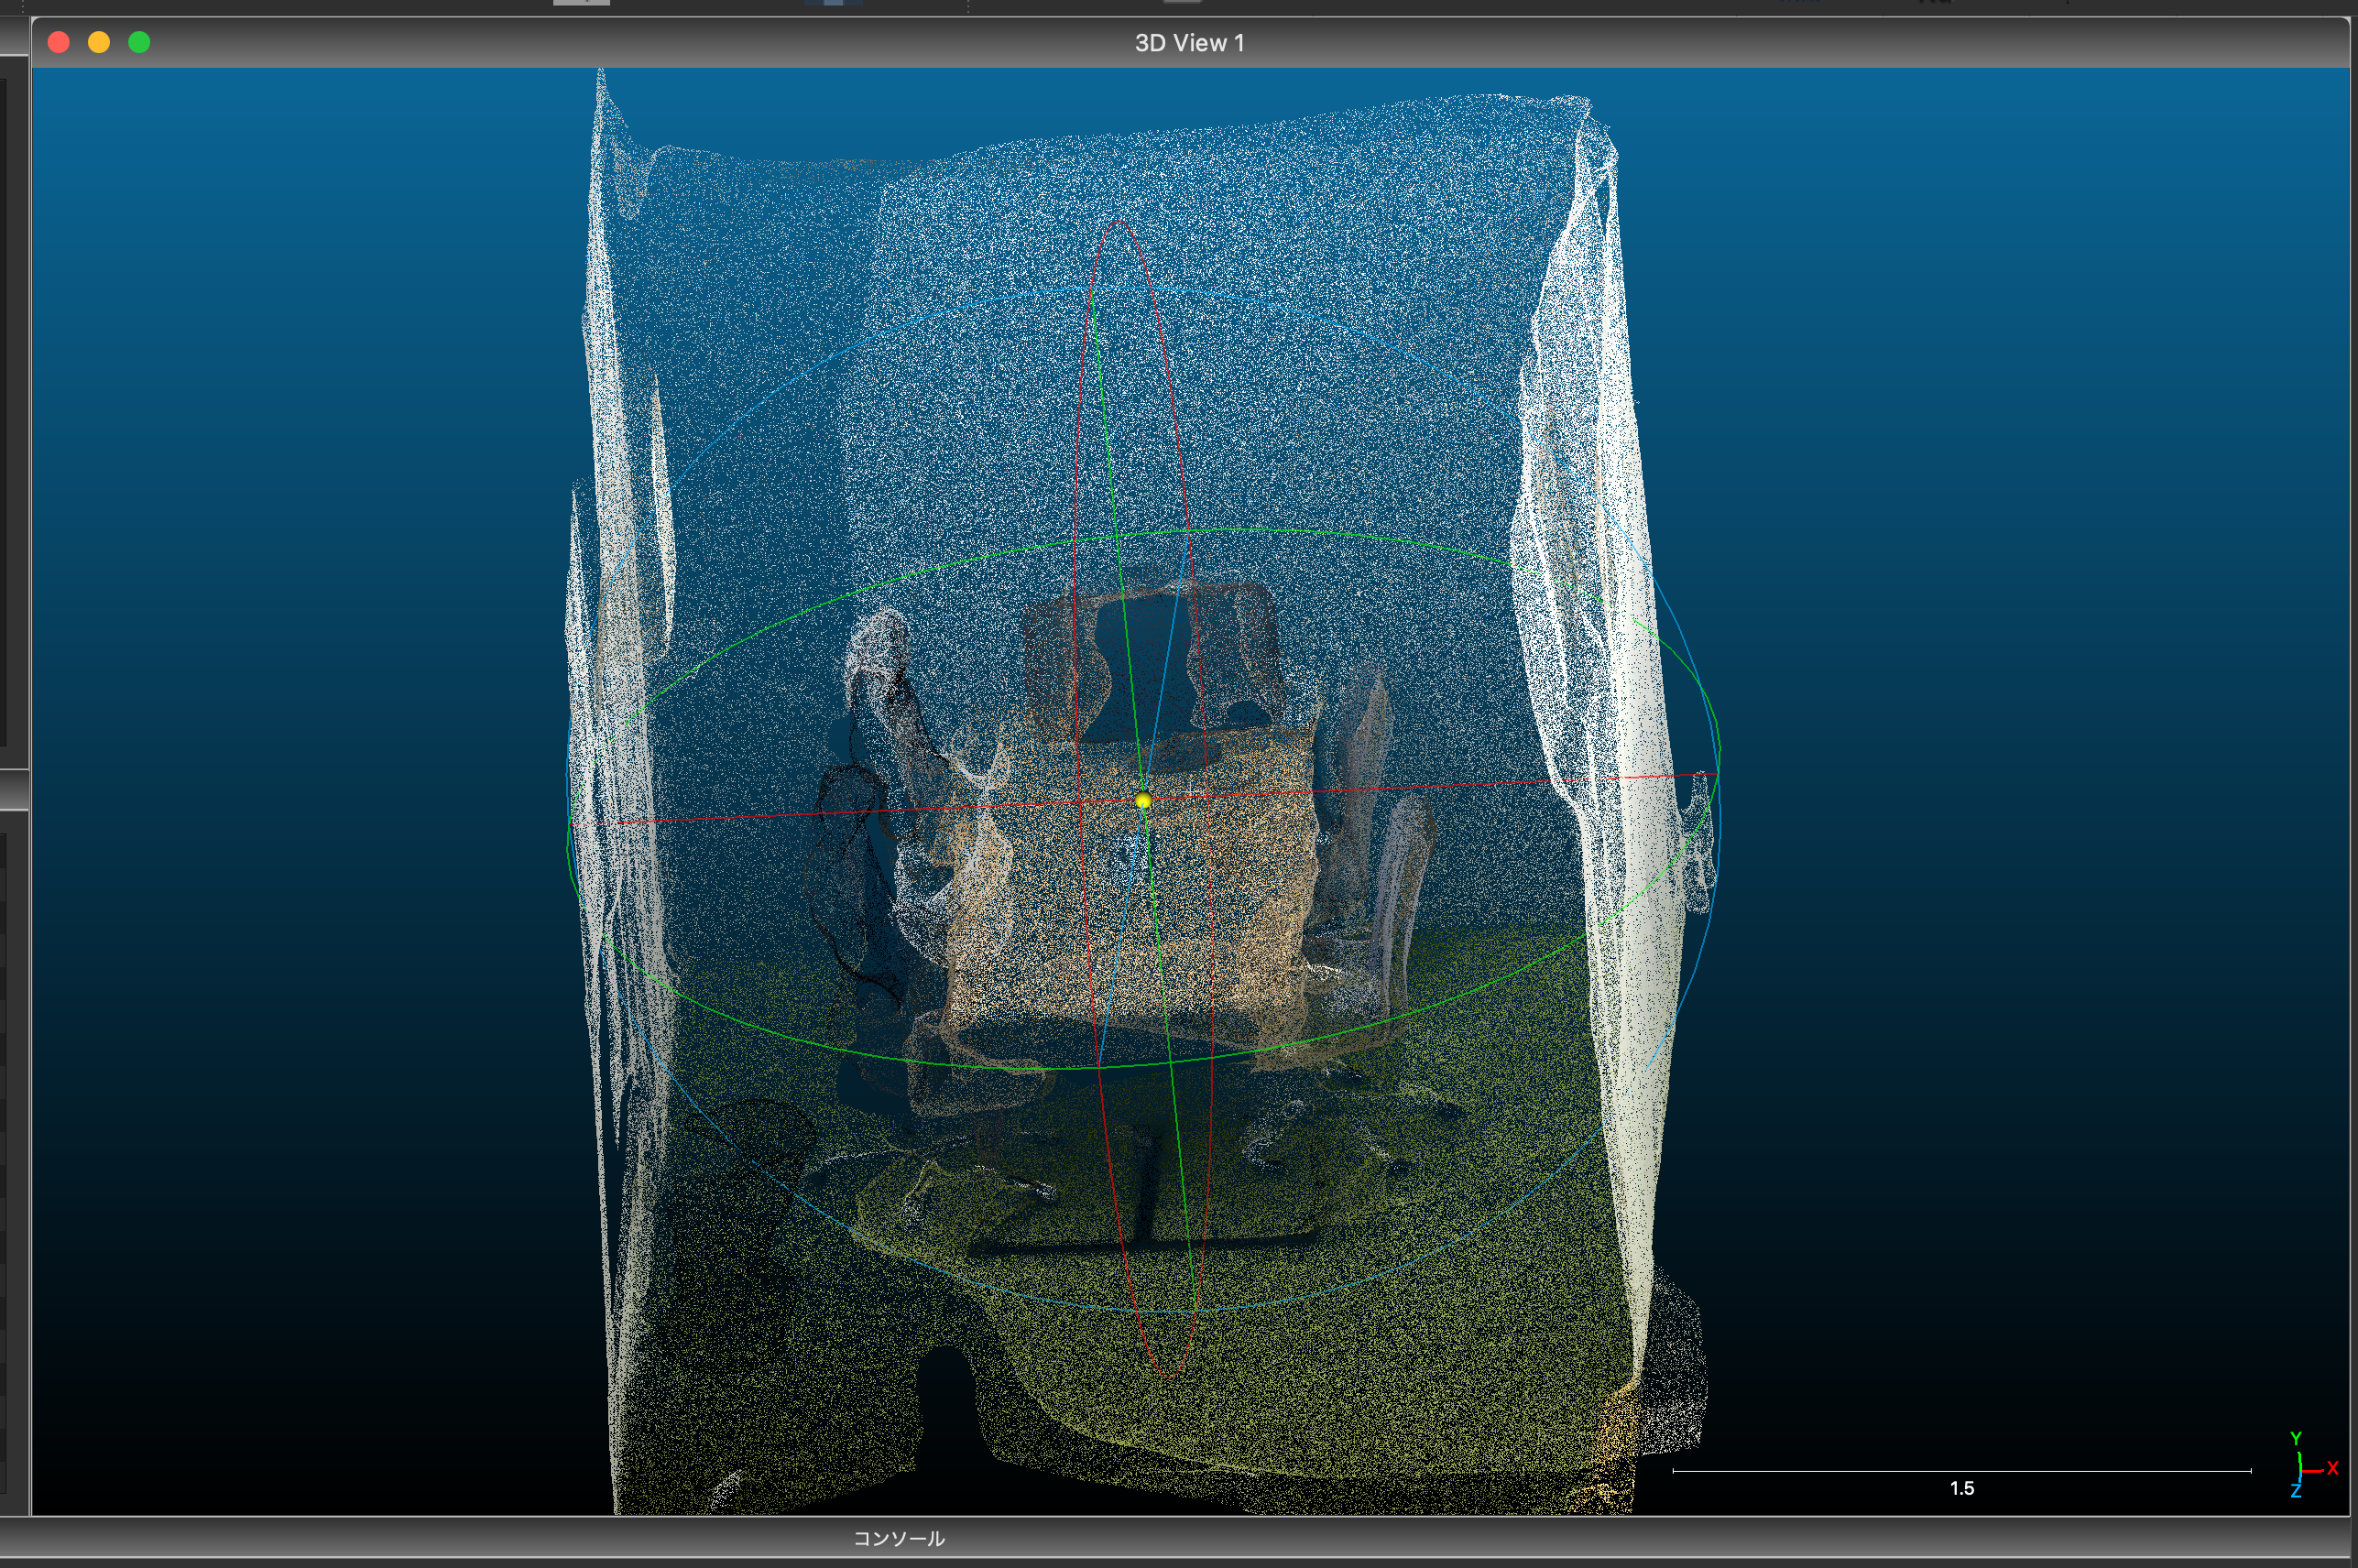
ひとまず3つのファイルをCloudCompareに読み込ませてみると、こんな感じで向きや位置がバラバラなことが分かると思います。
Pythonでも確認してみましょう。
jupyter notebookとOpen3D・numpyというライブラリを利用していきます。
import open3d as o3d
import numpy as np
import copy
pcd1_path = "../data/output/room1.ply"
pcd2_path = "../data/output/room2.ply"
# pcd3_path = "../data/output/room3.ply"
# 二つの点群を読み込んで表示する
# ソース点群をターゲットに合わせる、ということを行いたいので、ソース点群には変な初期変換行列を与えておくことで、変化が分かりやすくなる
def draw_registration_result(source, target, transformation):
source_temp = copy.deepcopy(source)
target_temp = copy.deepcopy(target)
source_temp.transform(transformation)
o3d.visualization.draw([source_temp, target_temp])
source = o3d.io.read_point_cloud(pcd1_path)
target = o3d.io.read_point_cloud(pcd2_path)
# # 初期変換行列を定義
initial_trans = np.identity(4)
initial_trans[0, 3] = 0
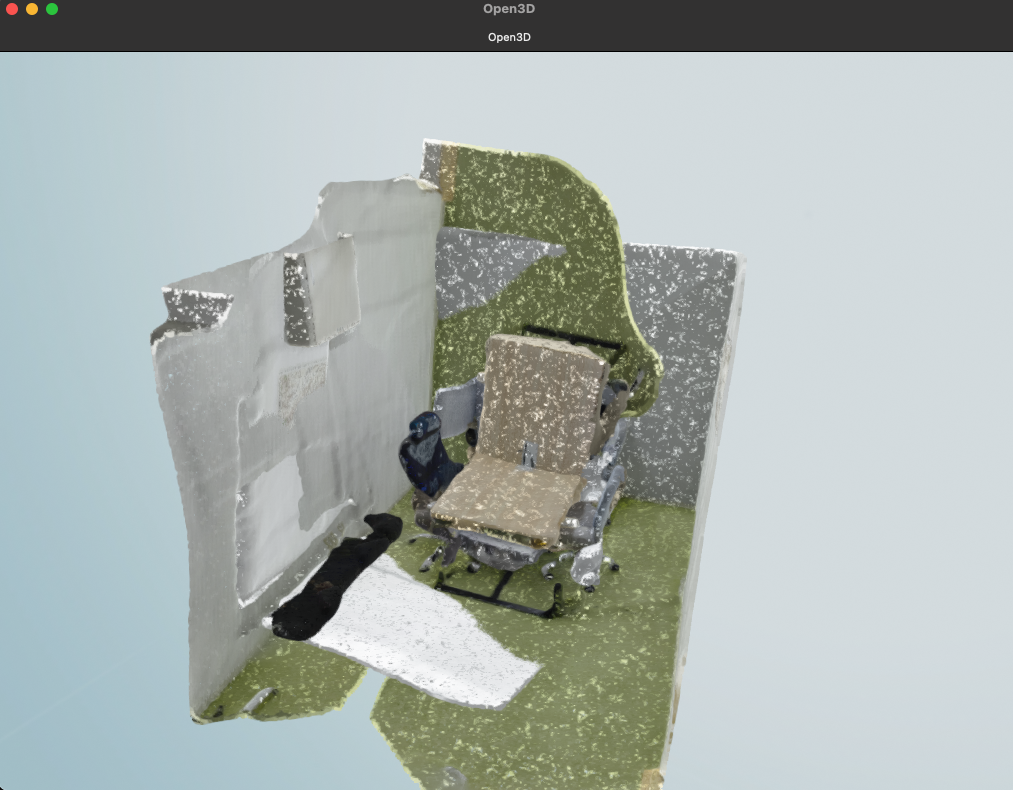
# 初期状態を描画
draw_registration_result(source, target, initial_trans)
すると、このようにテーブルの位置がすごいズレた点群が描画されるかと思います。
このデータをもとに、位置合わせを行なっていきましょう。
外れ値の除去
今回は複雑な構造のものもなく、室内で撮影しているので、あまり「外れ値」が出ることもないのですが、一般的な点群処理フローではこの外れ値を除去するのが普通ですので、行なっていきます。
今回は半径を指定して、逸脱する点を除去する方法を取るのですが、他にも色々種類がありますので、興味があれば調べてみてください!
voxel_size = 0.1
radius_normal = voxel_size * 2
source_cloud, source_index = source.remove_radius_outlier(nb_points=16, radius=radius_normal)
target_cloud, target_index = target.remove_radius_outlier(nb_points=16, radius=radius_normal)

draw_registration_result(source_cloud.select_by_index(source_index), target_cloud.select_by_index(target_index), initial_trans)
まぁ今回はほとんど違いはわからないと思います。
ダウンサンプリング→点群法線の推定→特徴量の抽出
位置合わせを行なっていく際に、点群の数が多すぎると計算量がとんでもないことになって処理落ちするので、ある程度先に間引いておきましょう。
ただし、荒すぎても位置合わせの結果が悪くなるので、そこはうまいこと調整する必要があるようでした。
点群の間引きと特徴量の抽出はまとめてではなく1つの点群ごとに行なっていきます。
def preprocess_point_cloud(pcd, voxel_size):
    # 指定サイズ(m単位)の立方体を作り、その中に点が含まれていてれば中心を取る
    # これを特徴点として扱う
    keypoints = pcd.voxel_down_sample(voxel_size)

    # 周辺の点群を用いて法線を推定
    # 法線計算のための範囲としてボクセルの倍の半径を指定する
    radius_normal = voxel_size * 2
    # 範囲内で30個の点を上限として用いて法線を計算する
    keypoints.estimate_normals(o3d.geometry.KDTreeSearchParamHybrid(radius=radius_normal, max_nn=30))

    # 各点のFPFH特徴量を抽出
    # 特徴量計算をするのに十分な点群の数を取得する必要があるため、今回はボクセルの5倍の半径を指定する
    radius_feature = voxel_size * 5
    # 特徴量を検出するため、範囲内で上限100個の点を用いる
    feature = o3d.pipelines.registration.compute_fpfh_feature(
        keypoints, o3d.geometry.KDTreeSearchParamHybrid(radius=radius_feature, max_nn=100)
    )
    return keypoints, feature

def prepare_dataset(pcd, voxel_size):
    # 点群をダウンサンプリングして、法線とFPFH特徴量を抽出
    keypoints, feature = preprocess_point_cloud(pcd, voxel_size)
    return keypoints, feature

voxel_size = 0.1
source_keypoints, source_feature = prepare_dataset(source_cloud.select_by_index(source_index), voxel_size)
target_keypoints, target_feature = prepare_dataset(target_cloud.select_by_index(target_index), voxel_size)
位置合わせ
特徴量抽出後、RANSACというアルゴリズムを用いて、まずはざっくりと位置合わせしていきます。
(この全体的なざっくり位置合わせをglobal registrationと呼ぶようです。)
def execute_global_registration(source_keypoints, target_keypoints, source_feature, target_feature,  voxel_size):
    distance_threshold = voxel_size * 1.5
    result = o3d.pipelines.registration.registration_ransac_based_on_feature_matching(
        source_keypoints,
        target_keypoints,
        source_feature,
        target_feature,
        True,
        distance_threshold,
        o3d.pipelines.registration.TransformationEstimationPointToPoint(False),
        3,
        [
            o3d.pipelines.registration.CorrespondenceCheckerBasedOnEdgeLength(0.9),
            o3d.pipelines.registration.CorrespondenceCheckerBasedOnDistance(distance_threshold),
        ],
        o3d.pipelines.registration.RANSACConvergenceCriteria(100000, 0.999),
    )
    return result

result_ransac = execute_global_registration(source_keypoints, target_keypoints, source_feature, target_feature, voxel_size)
# RANSACで推定された変換行列を用いて、点群を表示
draw_registration_result(source, target, result_ransac.transformation)
なんだかとんでもない結合がなされていますね…
これは特徴量の抽出がうまくいかなかった証拠です。
位置合わせを行う際のvoxel_sizeを調整して再度実行してみましょう。
# voxel_size = 0.1
voxel_size = 0.3
source_keypoints, source_feature = prepare_dataset(source_cloud.select_by_index(source_index), voxel_size)
target_keypoints, target_feature = prepare_dataset(target_cloud.select_by_index(target_index), voxel_size)

result_ransac = execute_global_registration(source_keypoints, target_keypoints, source_feature, target_feature, voxel_size)
# RANSACで推定された変換行列を用いて、点群を表示
draw_registration_result(source, target, result_ransac.transformation)
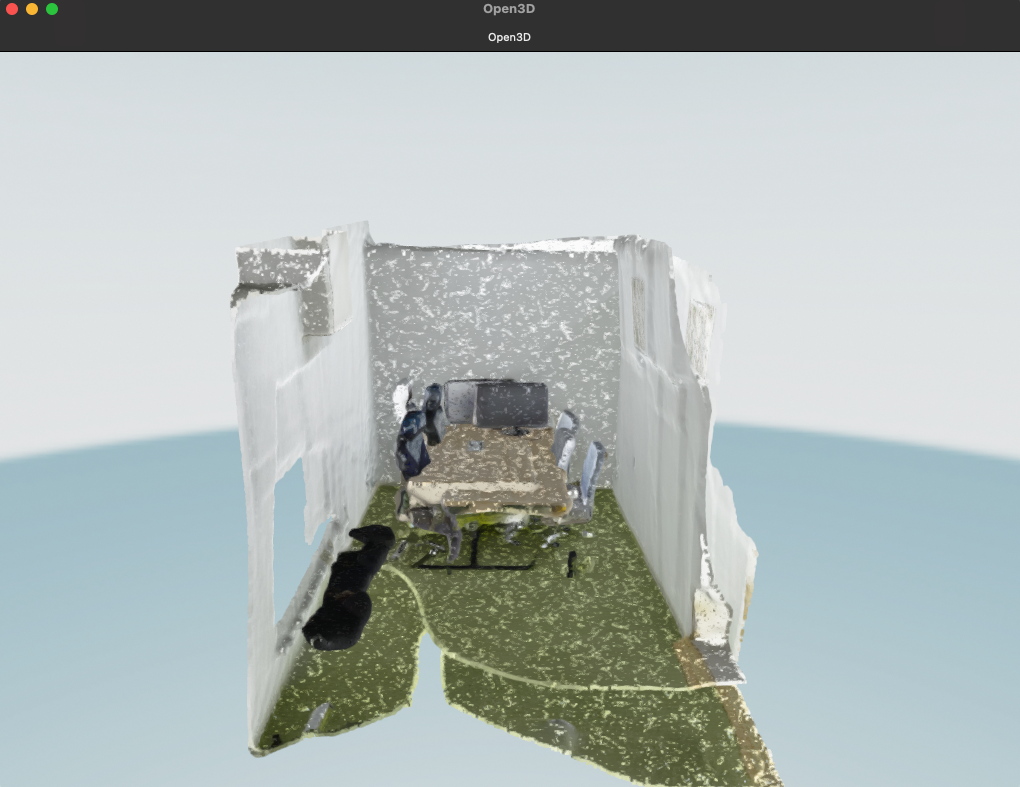
さっきよりも綺麗になったんじゃないかなと思います!
最後に、IPCというアルゴリズムを用いて微調整していきます。
(global registrationに対し、local registrationと言います)
# point to planeのIPCを利用してさらに調整(local registration))
def refine_registration(source, target, result_ransac, voxel_size):
distance_threshold = voxel_size * 0.4
result = o3d.pipelines.registration.registration_icp(
source,
target,
distance_threshold,
result_ransac.transformation,
o3d.pipelines.registration.TransformationEstimationPointToPlane(),
)
return result
result_icp = refine_registration(source_keypoints, target_keypoints, result_ransac, voxel_size)
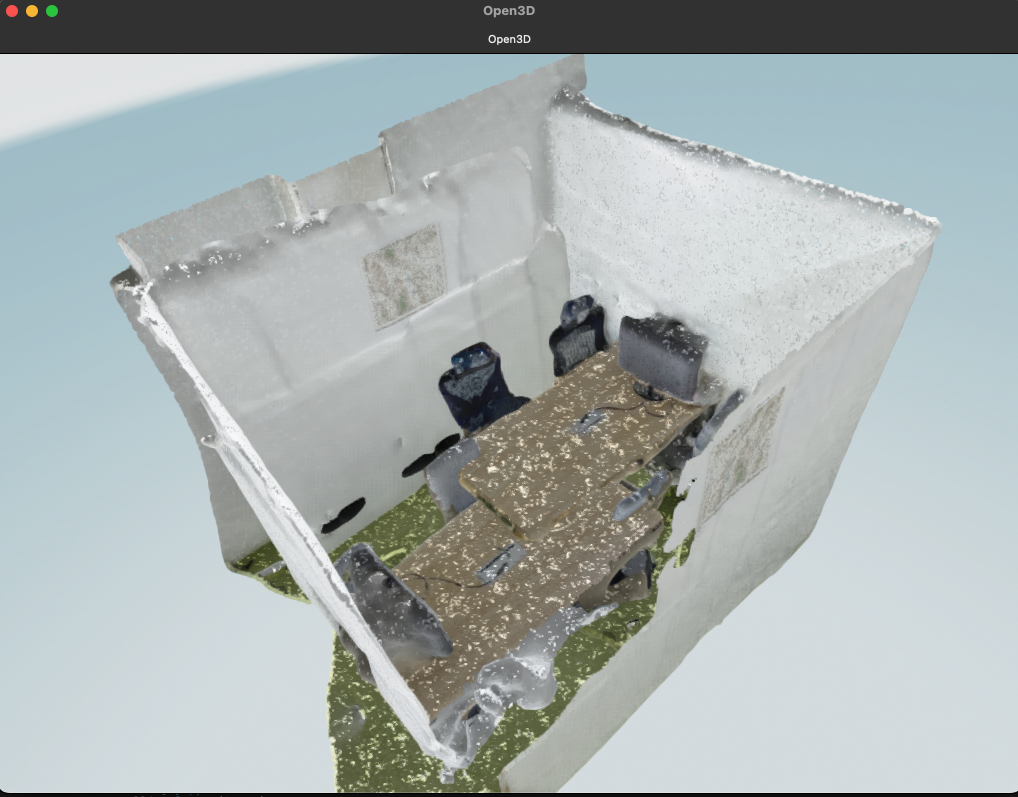
draw_registration_result(source, target, result_icp.transformation)
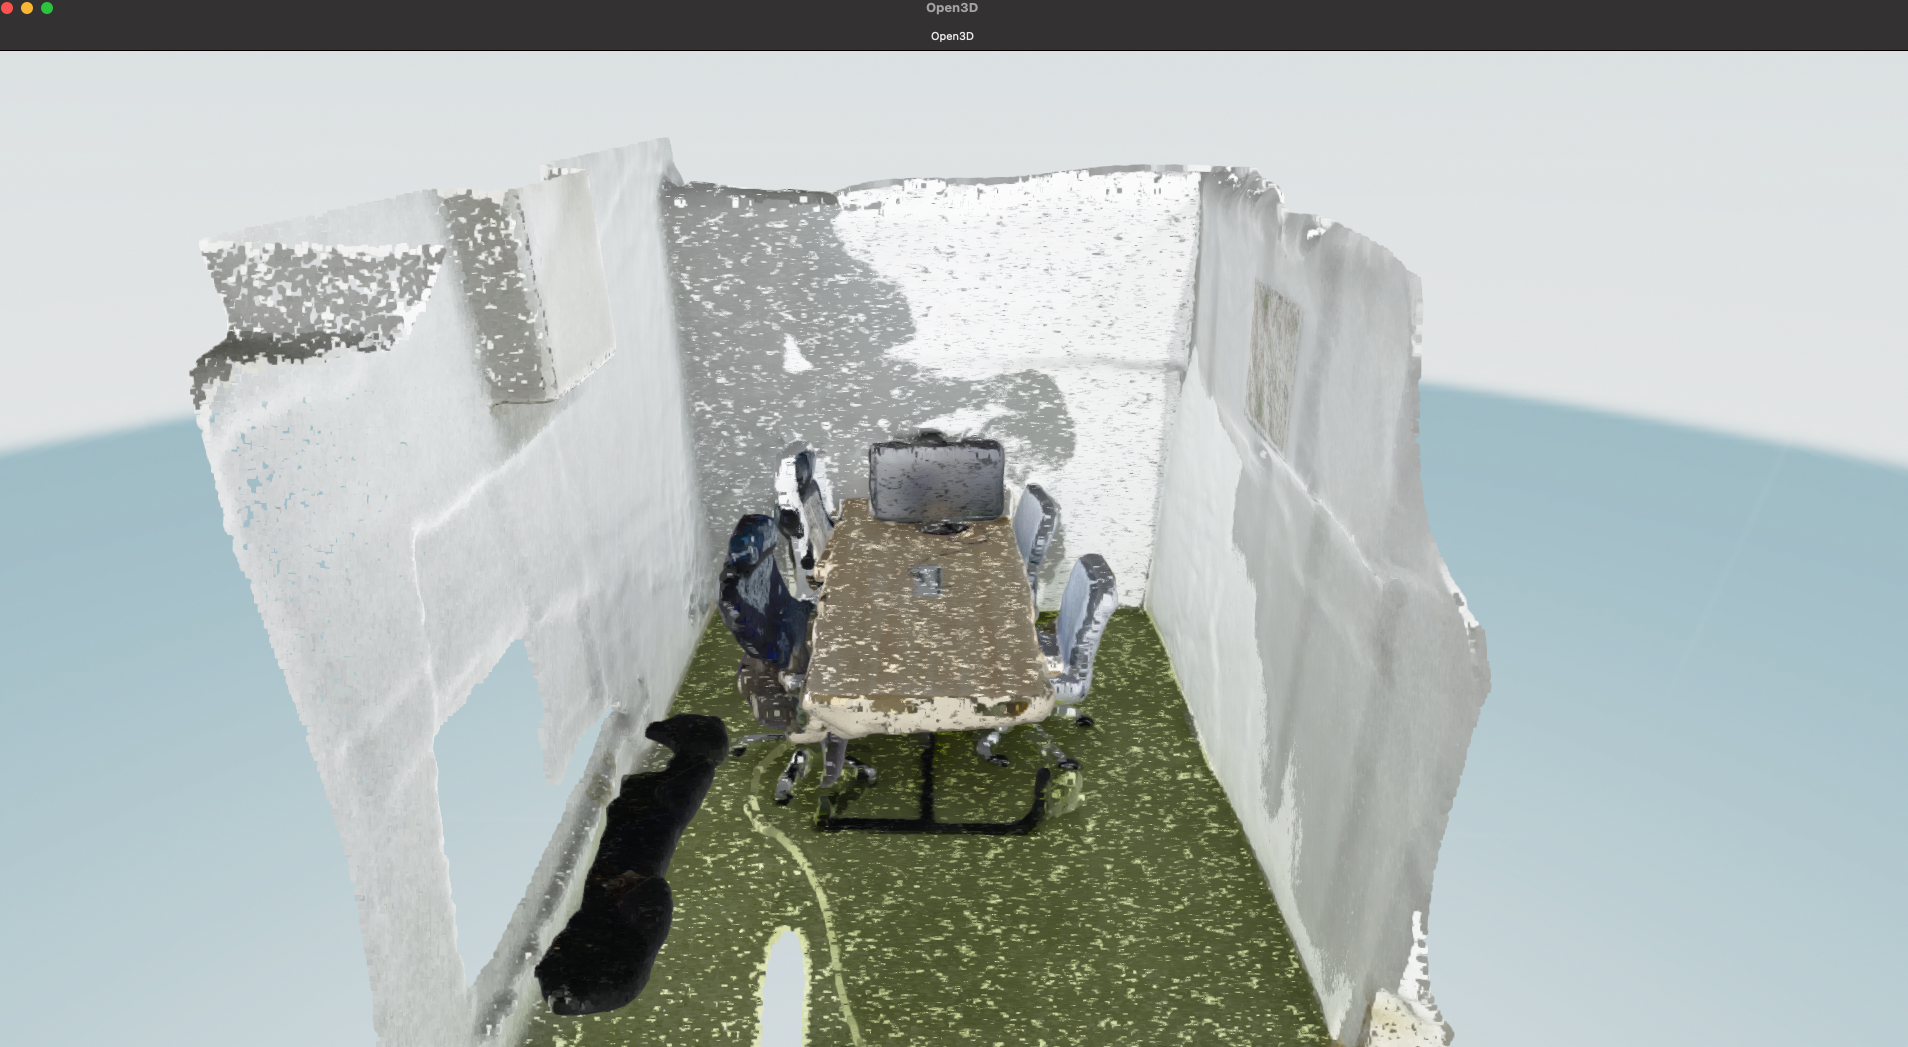
細かいところまで綺麗に重なったんじゃないかなと思います!!
出力
最後に結合されたデータを出力しましょう。
# sourceの点群を変換行列を用いて変換し、なおかつtargetの点群と結合
source.transform(result_icp.transformation)
pcd = source + target

o3d.io.write_point_cloud("data/output/merged.ply", pcd)
同じことを繰り返せば、もう一つの点群データも位置合わせ・結合ができます!
ボクセル化
これで終了でもいいんですが、ボクセルにすると可愛かったのでちょっとだけ紹介します。
利用しているOpen3Dというライブラリは、点群データのボクセル化機能があるので、それをつかってみましょう。
voxel_size = 0.1
voxel = o3d.geometry.VoxelGrid.create_from_point_cloud(pcd, voxel_size)
o3d.visualization.draw(voxel)
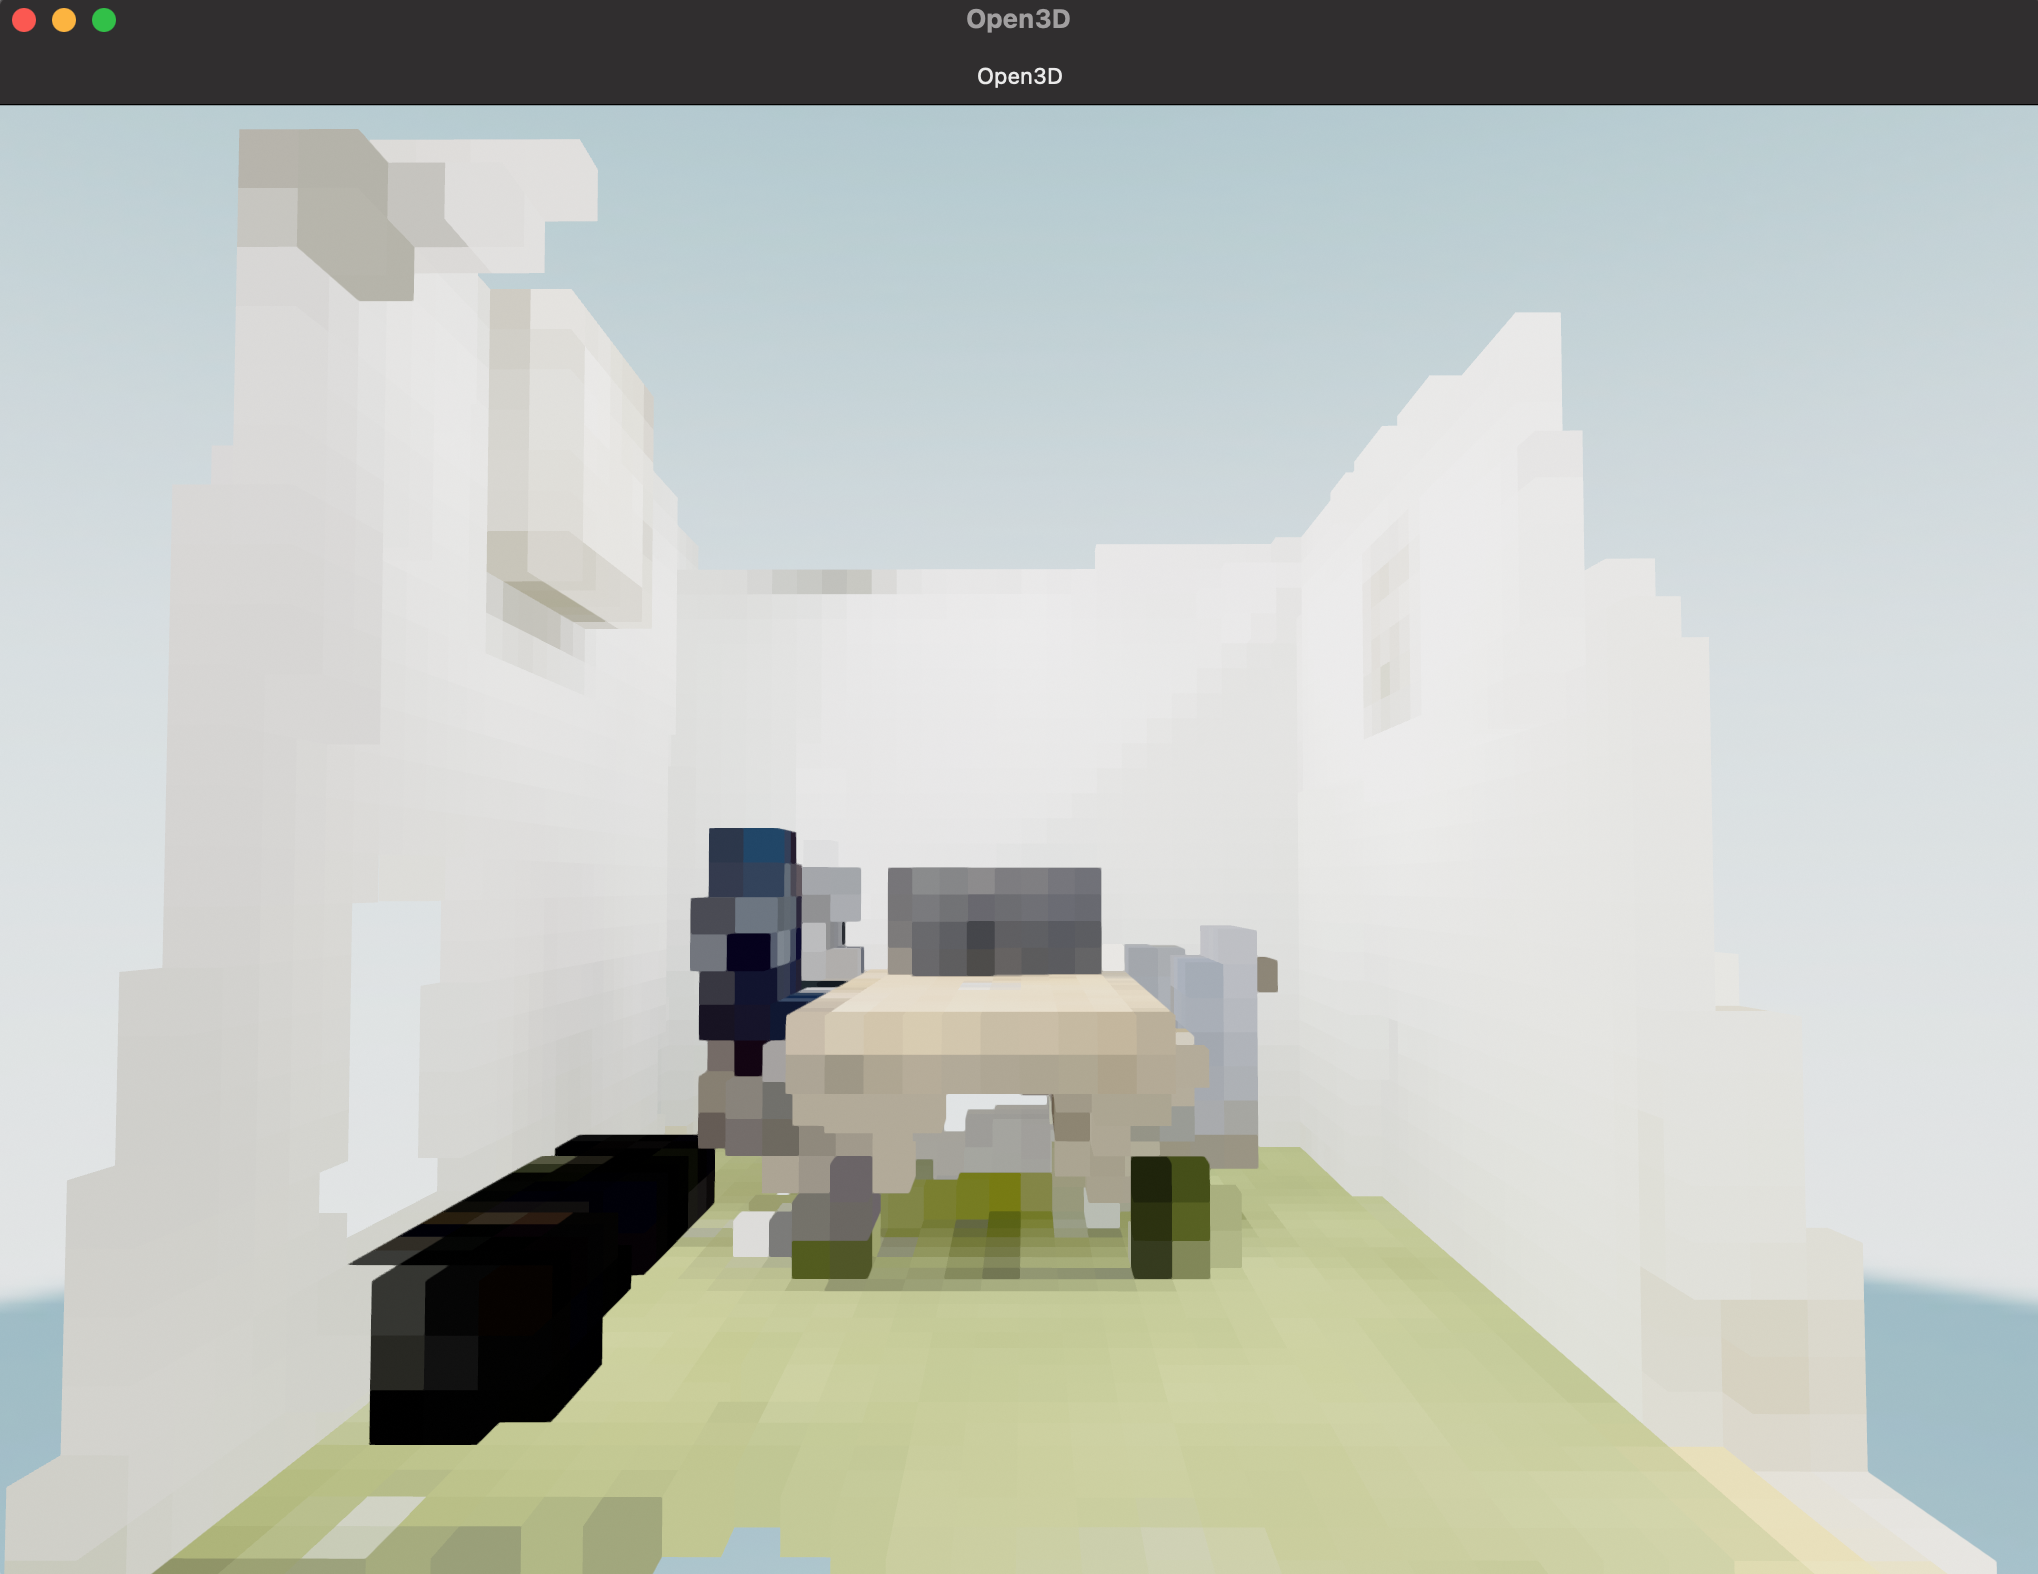
いい感じですね!!!
おわりに
ということで今回は「点群データの位置合わせ・結合」についてやっていきました。
Open3Dを利用すれば点群データの他に、一般的な3Dデータ形式である「三角メッシュ」も簡単に取り扱え、解析などもできます!!!
みなさん使ってみてください!