このエントリは AWS Analytics Advent Calendar 2024 の10日目の記事です。
今北産業
- Amazon QuickSightがHighchartsをサポートして、表現の幅が広がった。
- QuickSightでHighchartsを使って描画する例を挙げてみた。
- Highchartsを活用するときはデモやサンプルが参考になる。
はじめに
Amazon QuickSightはAWSが提供するクラウドBIサービスです。QuickSightサポートしている可視化方法(ビジュアルタイプ)に使いたいものが無い場合、別のビジュアルタイプを選択するしかワークアラウンドがありませんでした。
QuickSightでHighchartsをサポートすることで、QuickSightがネイティブに対応していないグラフの描画ができるようになりました。折れ線グラフなどのグラフでもHighchartsを使って描画することで、ネイティブの機能では対応していない調整を行えることがあります。
Highchartsとは?
Highchartsは図表やグラフを作成するためのJavaScriptライブラリです。ライブラリのお作法に従ってJavaScript,CSS,HTMLによりSVGを生成することで柔軟な表現が実現できます。

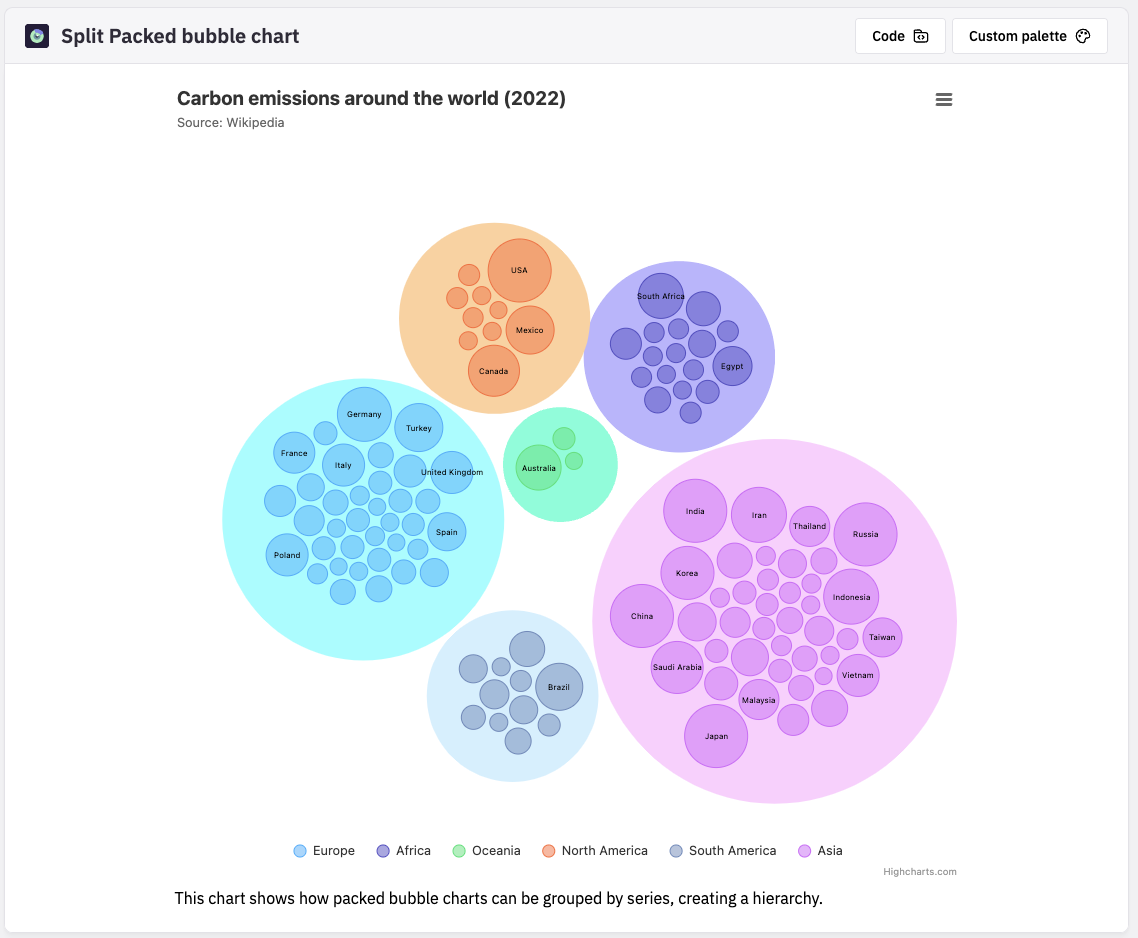
(https://www.highcharts.com/demo/highcharts/packed-bubble-split より引用)
やってみる
今回は、QuickSightのサンプルデータとして提供されているSales Pipelineのデータセットを利用します。
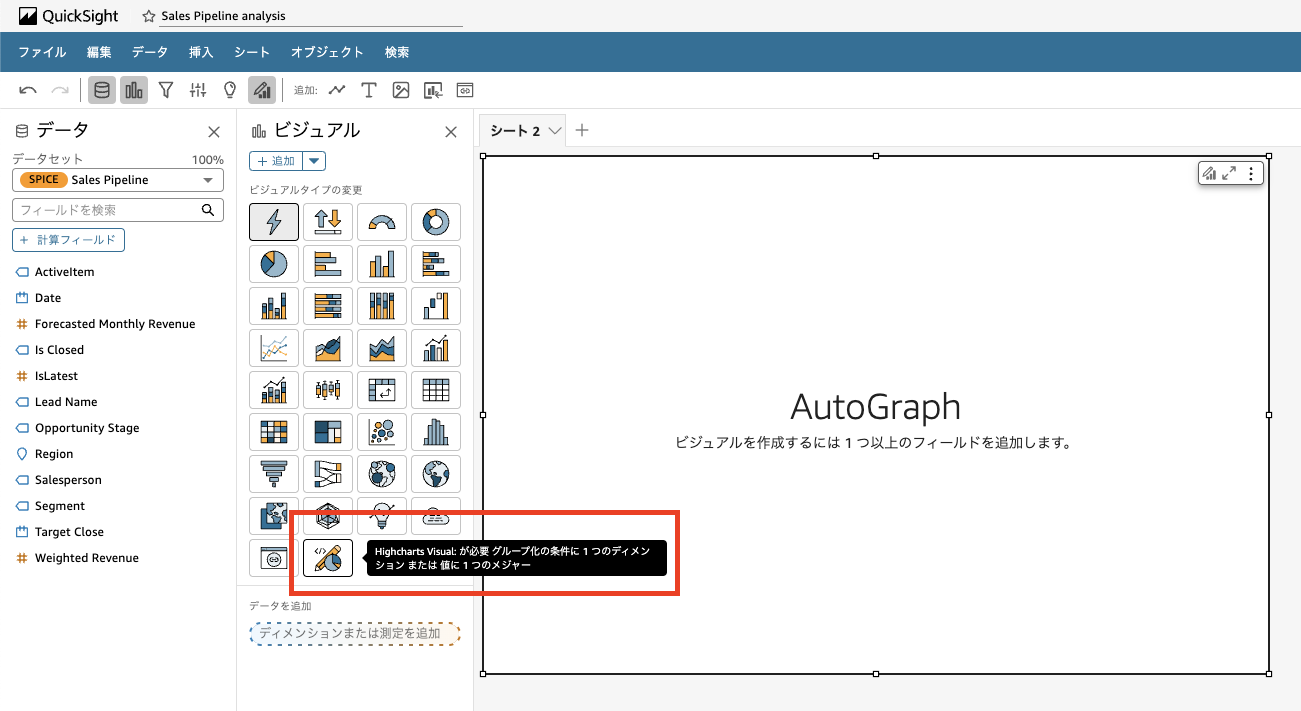
QuickSightの画面からHighcharts Visualを選択します。

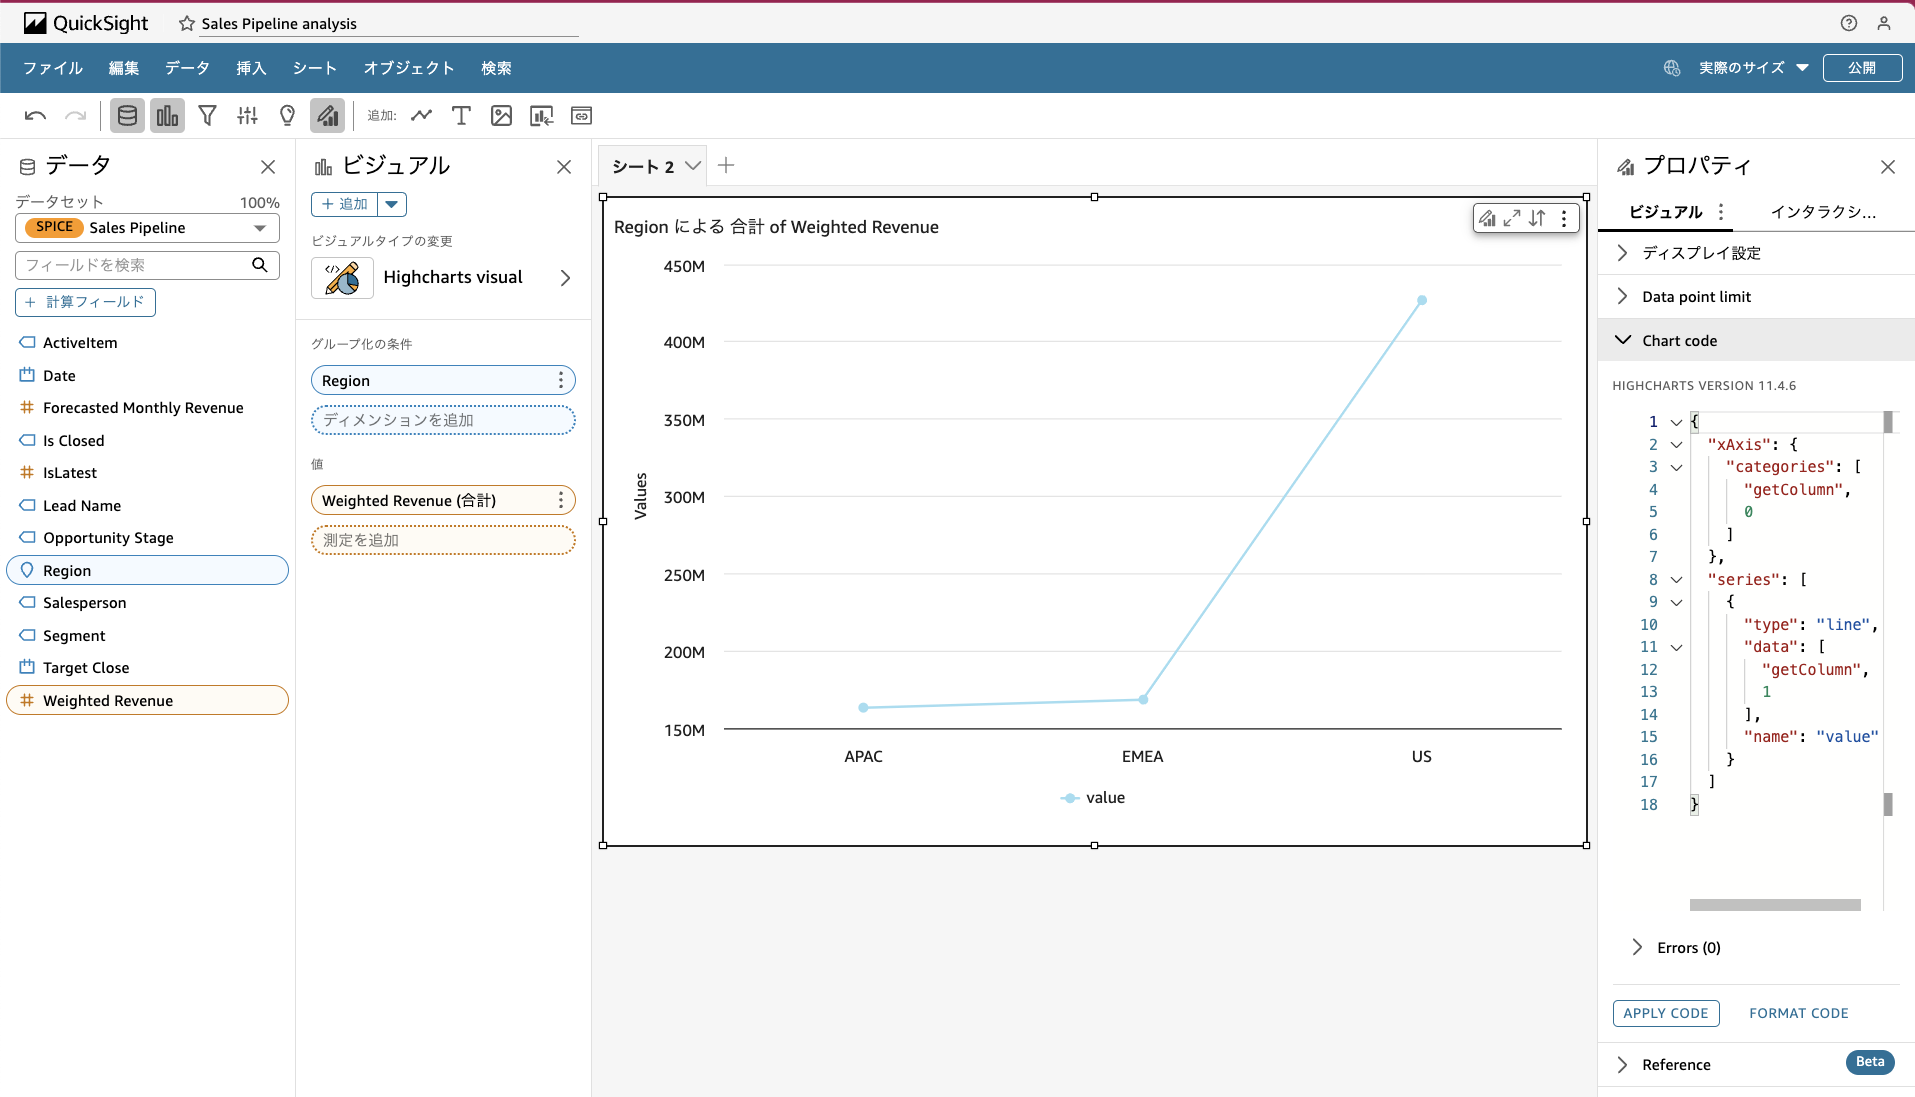
グループ化の条件にRegionを、値にWeighted Revenueを選択すると、デフォルトでは折れ線グラフが表示されます。

いまの状態は以下のような集計クエリの実行結果を可視化するものと考えられます。
SELECT
    Region
    SUM("Weighted Revenue")
FROM sample_table
GROUP BY Region
chart codeを見てみると、以下のようになっており、
X軸のカテゴリとして集計結果の1カラム目(0オリジン)、値として集計結果の2カラム目(0オリジン)が使われていることがわかります。
{
  "xAxis": {
    "categories": [
      "getColumn",
      0
    ]
  },
  "series": [
    {
      "type": "line",
      "data": [
        "getColumn",
        1
      ],
      "name": "value"
    }
  ]
}
もうちょっとやってみる
これだけでは面白くないので、もう少し複雑な可視化をしてみます。
QuickSightの画面からHighcharts Visualを選択します。

グループ化の条件にSegment, Regionを、値にWeighted Revenueを選択すると、以下のようなクエリの実行結果を可視化するのと等価です。
SELECT
    Segment,
    Region,
    SUM("Weighted Revenue")
FROM sample_table
GROUP BY Segment, Region
このタイミングでは先程同様に折れ線グラフが表示されているのですが、このビジュアルの鉛筆マーク(ビジュアルのフォーマット)をクリックし、プロパティ→ビジュアル→chart codeと表示すると、テキストエリアが表示されます。このテキストエリアにHighcharts JSONを入力し、APPLY CODEをクリックするとグラフが描画されます。
{
  "xAxis": {
    "type": "category",
    "categories": ["unique", ["getColumn", 0]] //Industry
  },
  "yAxis": {
    "title": {
      "text": "Sales"
    }
  },
  "tooltip": {
    "pointFormat": "<span style='color:{point.color}'>\u25CF</span> <b>{series.name} </b> : {point.y:,.2f}"
  },
  "plotOptions": {
    "series": {
      "borderRadius": "25%"
    }
  },
  "series": [
    "+", //Adding dynamic column series with pie and line series
    //Yes, + operator allow your to add arrays as well.
    [
      "map", //Iterate through below list
      ["unique", ["getColumn", 1]], //Region
      {
        "type": "column",
        "name": ["item"], //AMER, APJ, EMEA
        "data": [
          "map",
          [
            "filter",
            ["getColumn", 0, 1, 2], //Region, Industry, Sales
            ["==", ["get", ["item"], 1], ["item", 2]] //Where region = region from outer map
          ],
          {
            "name": ["get", ["item"], 0], //Industry
            "y": ["get", ["item"], 2] //Sales
          }
        ]
      }
    ],
    [
      //Create series entry for line chart
      {
        "type": "line",
        "name": "Avg Sales",
        "data": [
          "map",
          ["unique", ["getColumn", 0]], //Industry
          {
            "name": ["item"], //Communication, Consumer products etc
            //There will be three rows returned for each industry - one per region
            //So, calculating average by diving sum of sales by sum of 1.
            //Keeping the denominator dynamic to allow for addition of more regions
            "y": [
              "/",
              //Sum of sales using reduce operation
              [
                "reduce",
                [
                  "filter",
                  ["getColumn", 0, 2], //Industry, Sales
                  ["==", ["get", ["item"], 0], ["item", 2]] //Where Industry = Industry from outer map
                ],
                ["+", ["acc"], ["get", ["item"], 1]], //Add Sales to accumulator
                0 //Starting value of accumulator
              ],
              //Same reduce logic as above, except that we add static value 1
              [
                "reduce",
                [
                  "filter",
                  ["getColumn", 0, 2],
                  ["==", ["get", ["item"], 0], ["item", 2]]
                ],
                ["+", ["acc"], 1], //Adding static value of 1 to accumulator
                0
              ]
            ]
          }
        ]
      },
      //Create series entry for pie chart
      {
        "type": "pie",
        "name": "Regional Sales",
        "data": [
          "map",
          ["unique", ["getColumn", 1]], //Region
          {
            "name": ["item"], //AMER, APJ, EMEA
            //There will be ten rows returned for each region - one per industry
            //So, calculating sum of sales across these rows for each region.
            "y": [
              "reduce",
              [
                "filter",
                ["getColumn", 1, 2], //Region, Sales
                ["==", ["get", ["item"], 0], ["item", 2]] //Where region == region from outer map
              ],
              ["+", ["acc"], ["get", ["item"], 1]], //Add Sales to accumulator
              0 //Starting value of accumulator
            ],
            "dataLabels": [
              "case",
              //Using data label of first donut segment to show the overall total
              ["==", ["itemIndex"], 0],
              {
                "enabled": true,
                "distance": -50,
                "format": "{point.total:,.0f}"
              },
              //Disabling datalabel for other segments
              { "enabled": false }
            ]
          }
        ],
        "center": [75, 55],
        "size": 100,
        "innerSize": "70%"
      }
    ]
  ]
}
折れ線グラフと線グラフを同時に表示することは以前からもできましたが、加えてドーナツグラフも表示されています。

もっと活用するには?
このHighcharts用のJSONを自分でイチから書くのは、Highcharts自体の理解もある程度必要であり、非常に骨が折れる作業です。そのため、さまざまなサンプルを元に自分がやりたい表現を実装する、生成AIの補助を受けながら実装するのがよいです。
QuickSightではDemo Centralというデモやチュートリアルがまとまったサイトを提供しており、Demo CentralにはHighchartsのDemoもあります。今回ご紹介したサンプルもこちらから引用したものです。
さいごに
Amazon QuickSightのHighchartsのサポートに関する一例をあげました。ネイティブの機能で表現しきれないものがある場合にはぜひ使ってみてください。
