はじめに
Kubernetesのコンテナログを、Elastic Agentを使ってElasticsearchに入れる方法について紹介します。今回はElastic Stack v8.12を使っています。v8.8から登場したReroute processorというのを使っているため、検証はしていませんが、v8.8移行であれば同じように実践できると思います。
Elastic AgentをKubernetesにインストール
Integrations画面を開き、Kubenertesを検索します。
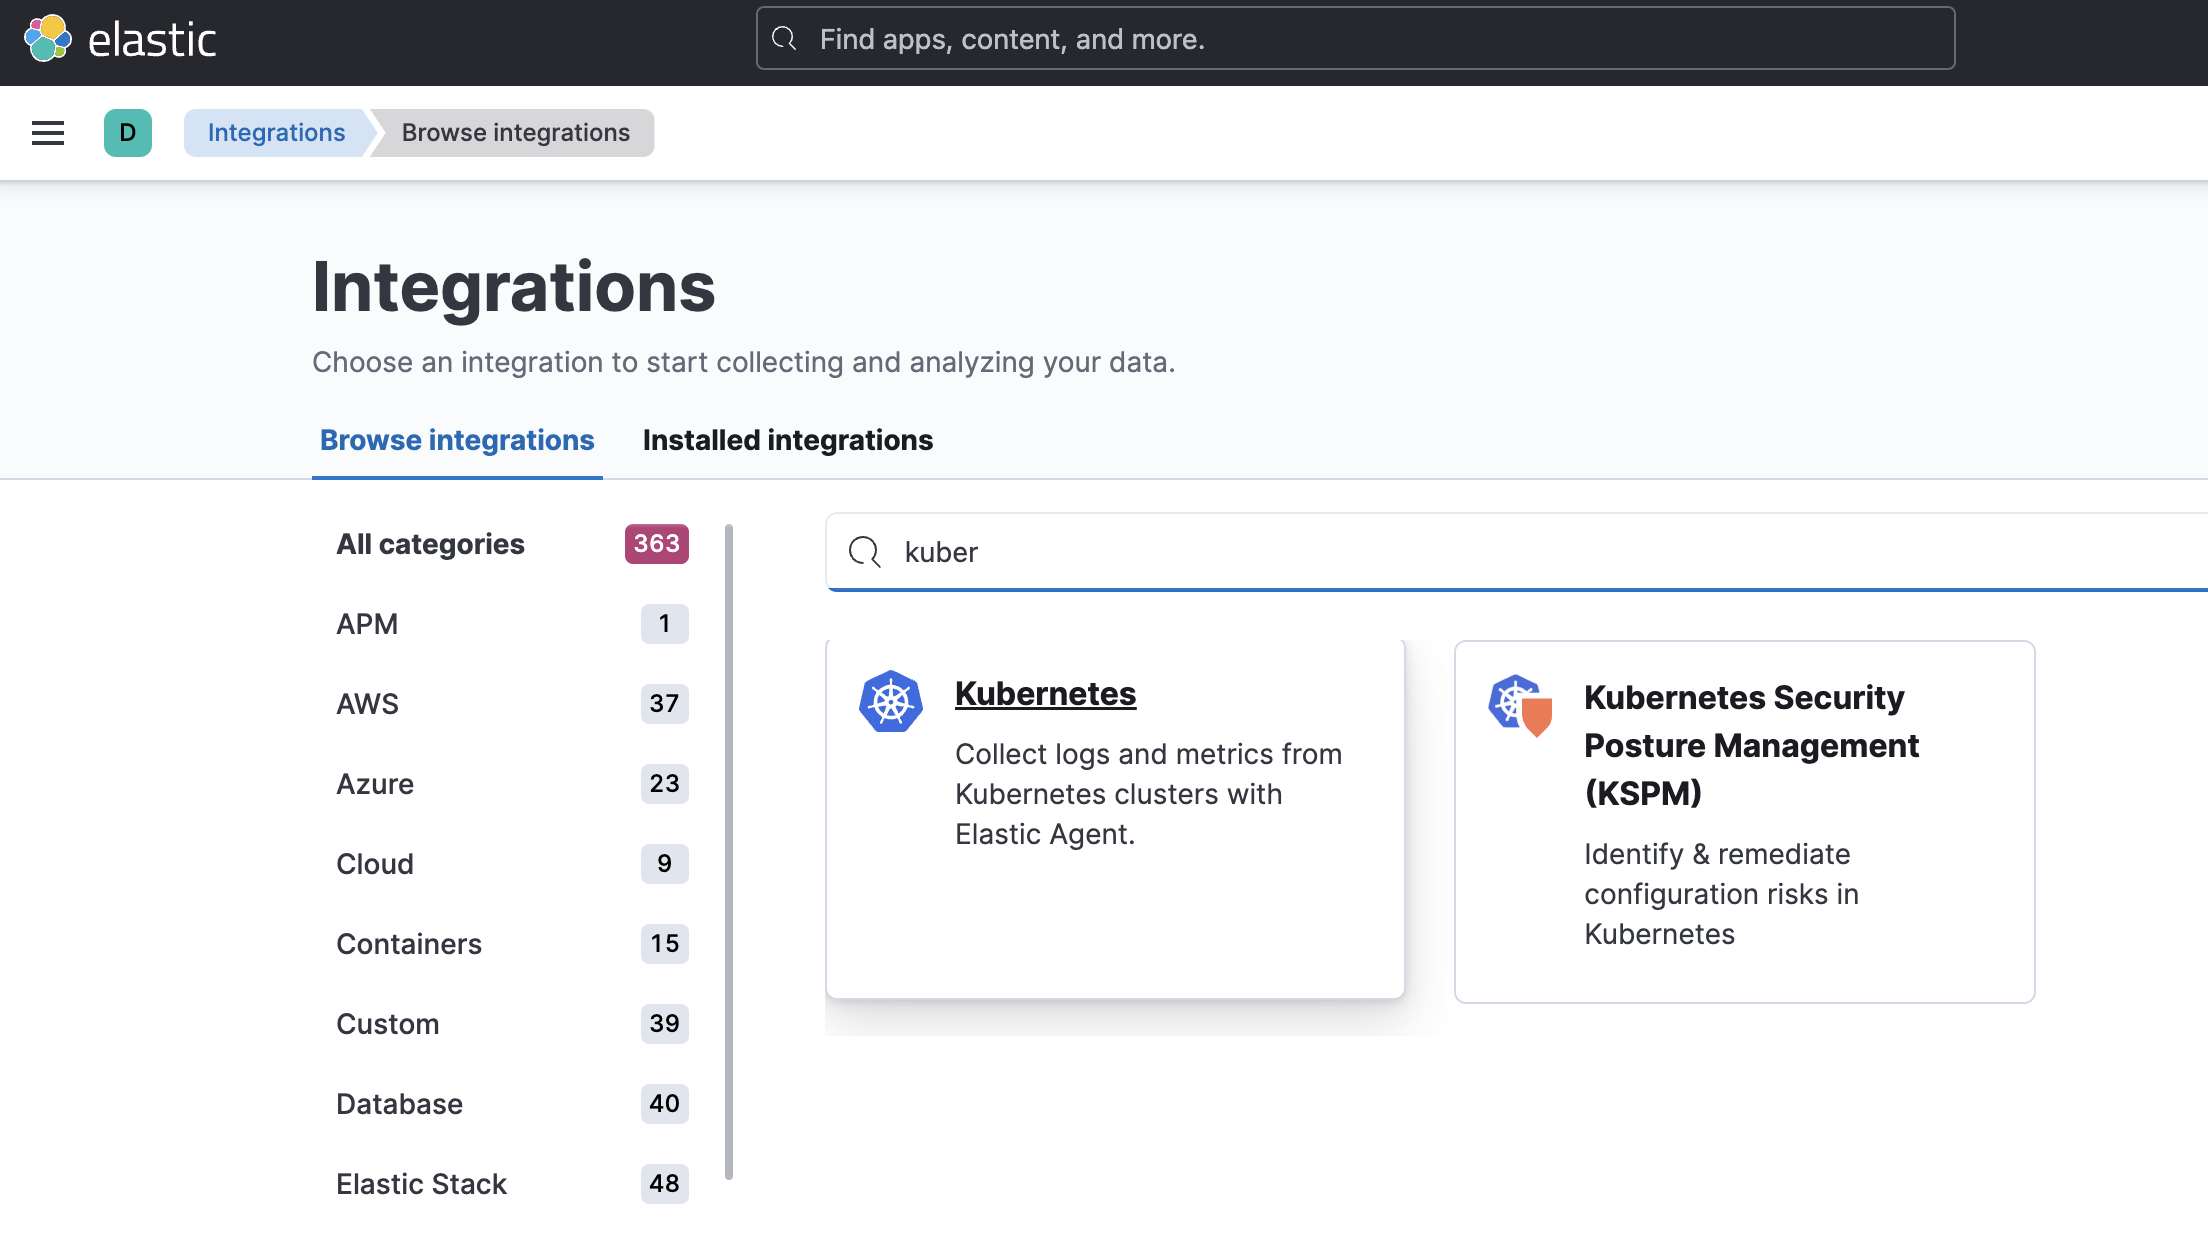
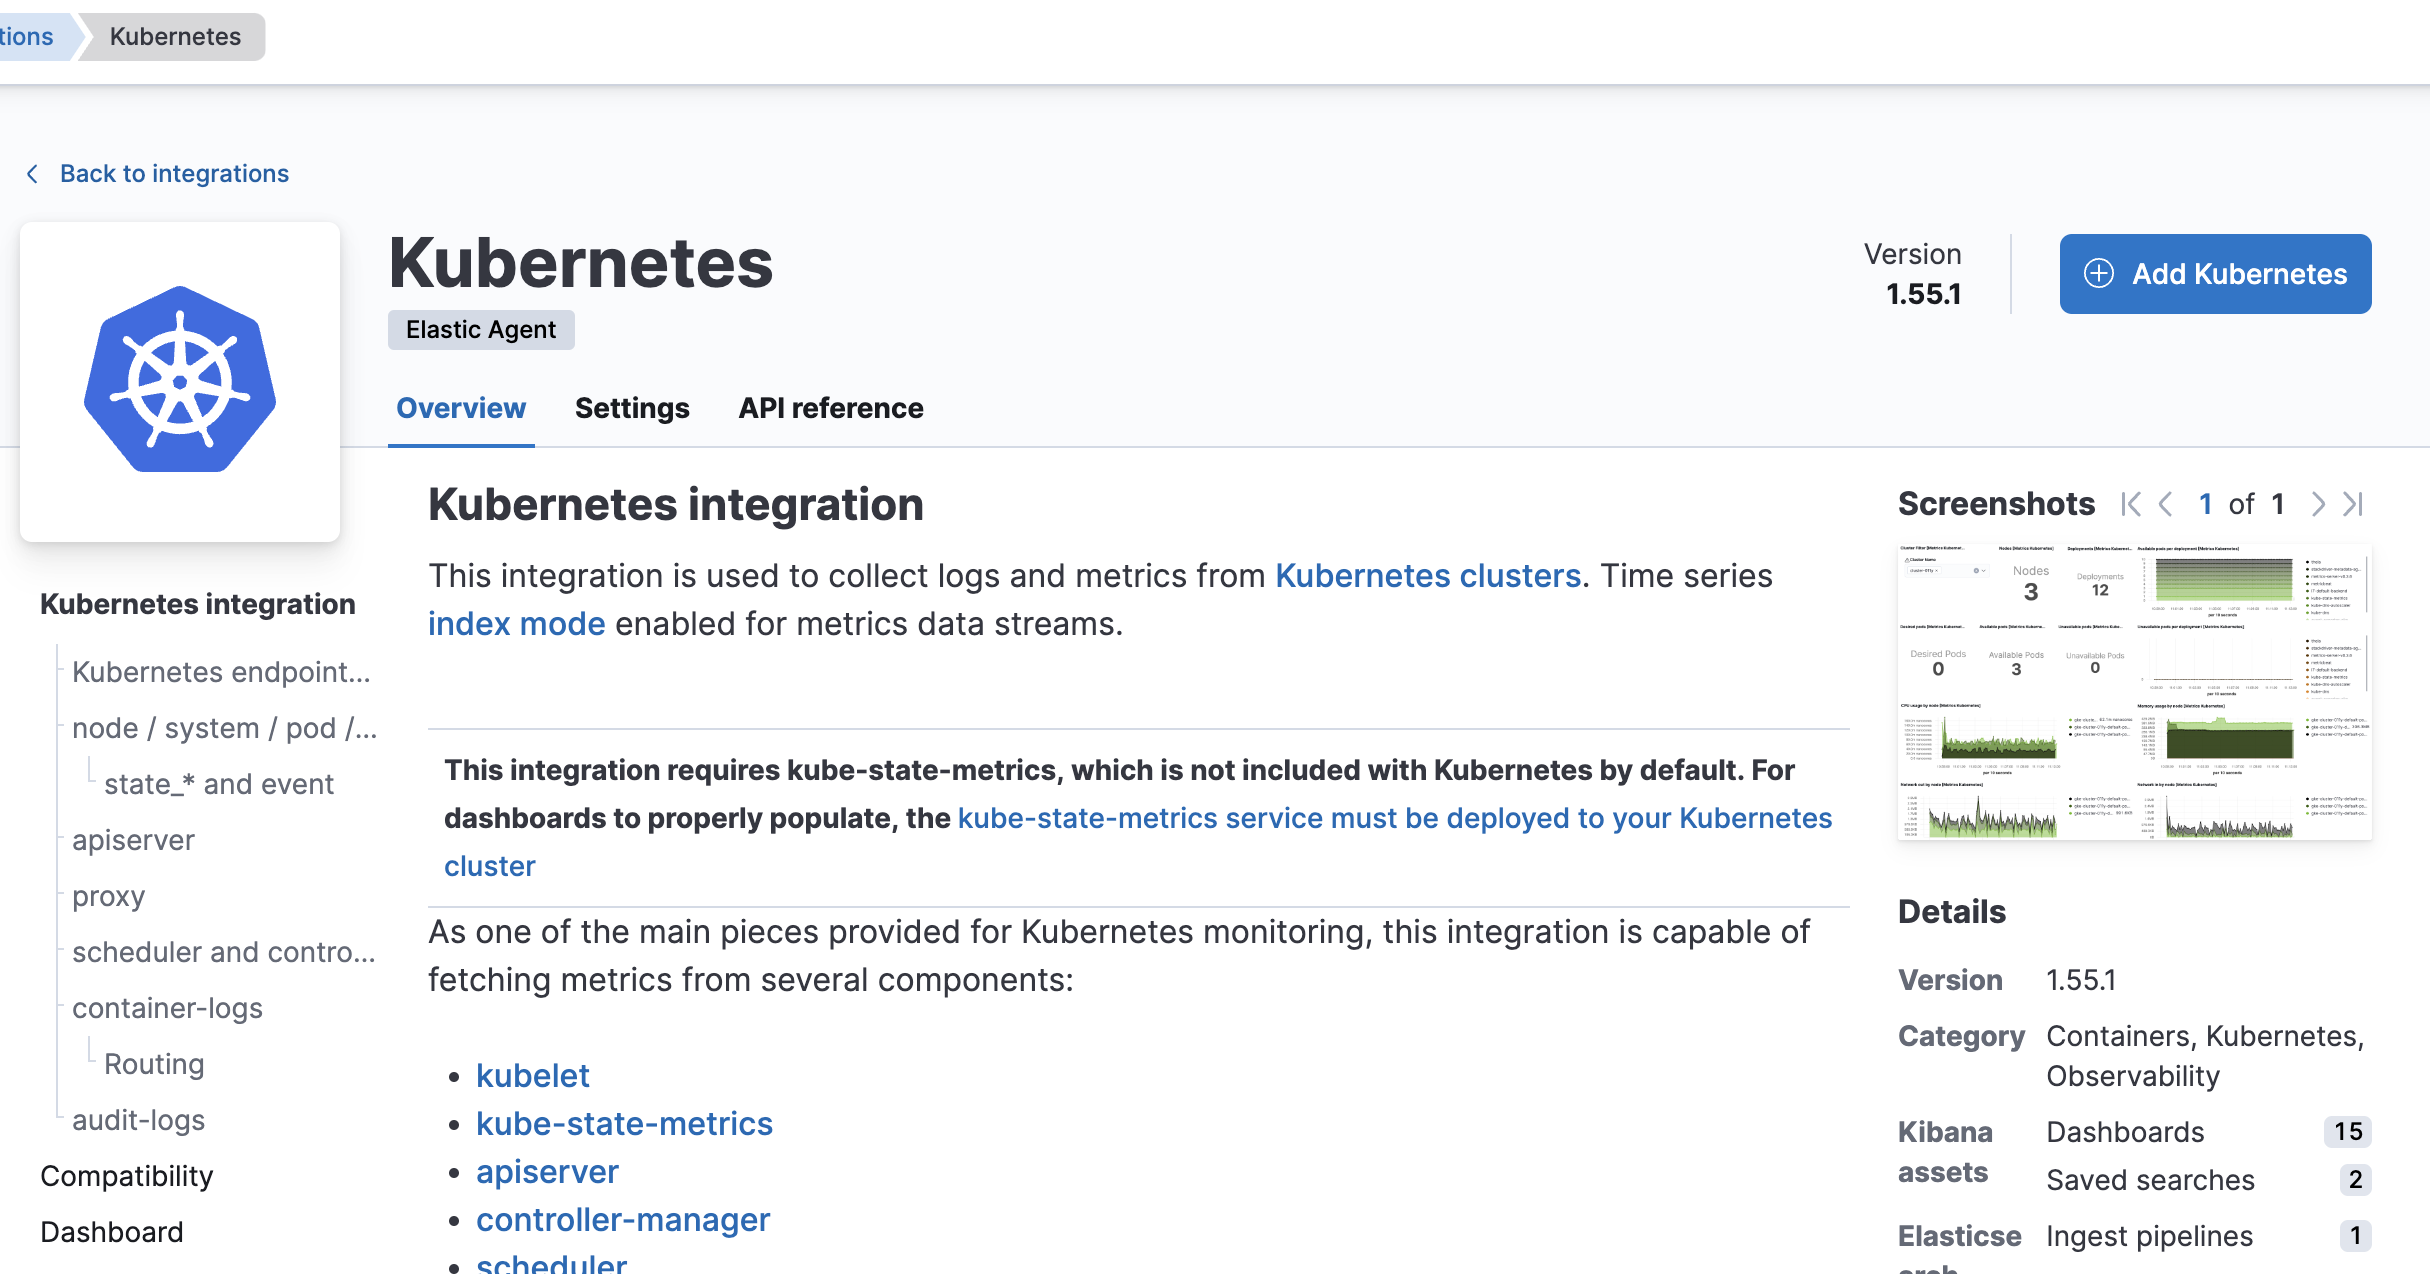
Add Kubenetesボタンを押します。
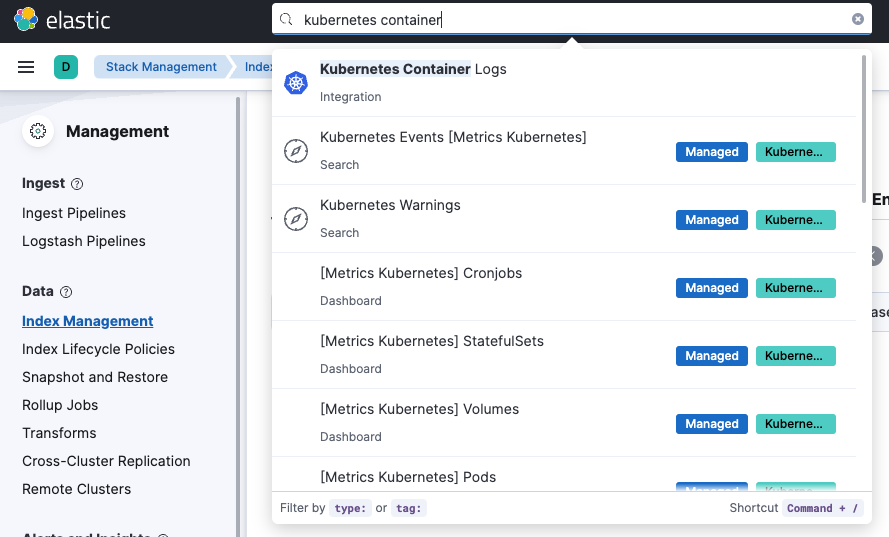
Tipsですが、Kuberenetes Container Logsで検索するのも別の方法として有効です。この場合、後続のステップでの選択項目が絞られて少し楽です。
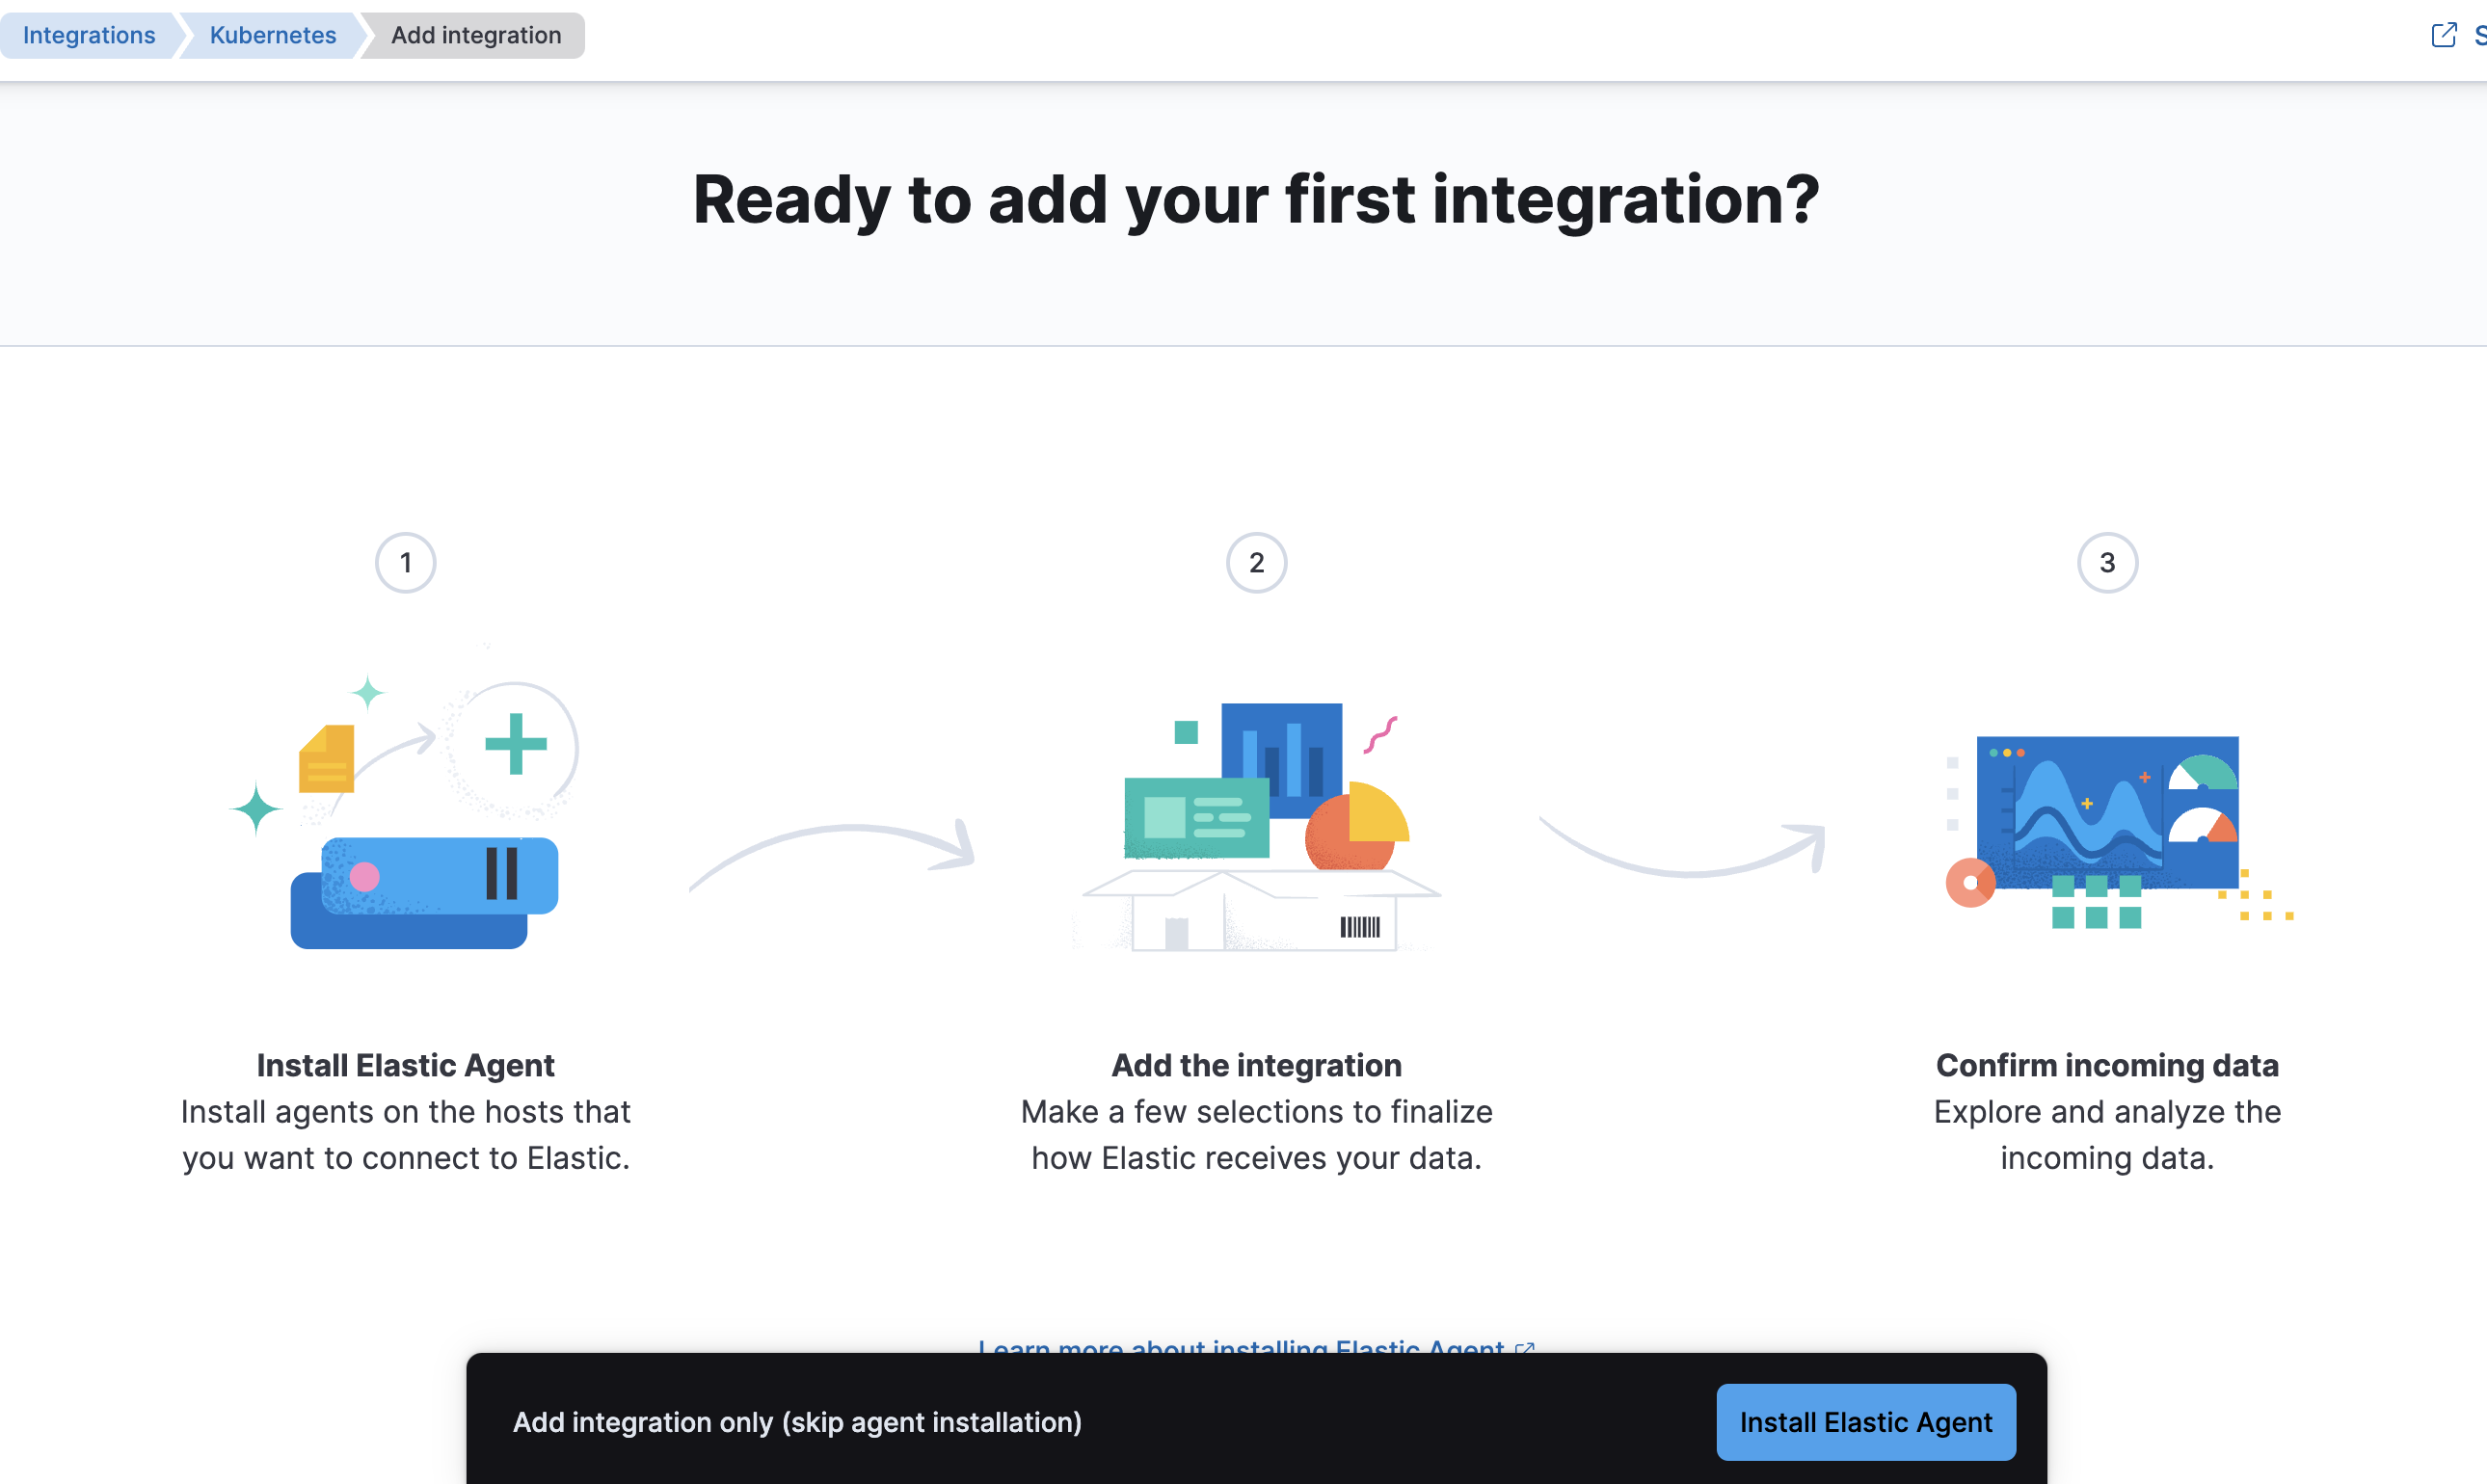
初めてElastic Agentをインストールする場合はこの画面が出ます。Install Elastic Agentを押します。
ユーザー接続情報が埋め込まれたデプロイメントファイルが表示されるので、それをコピーし ...
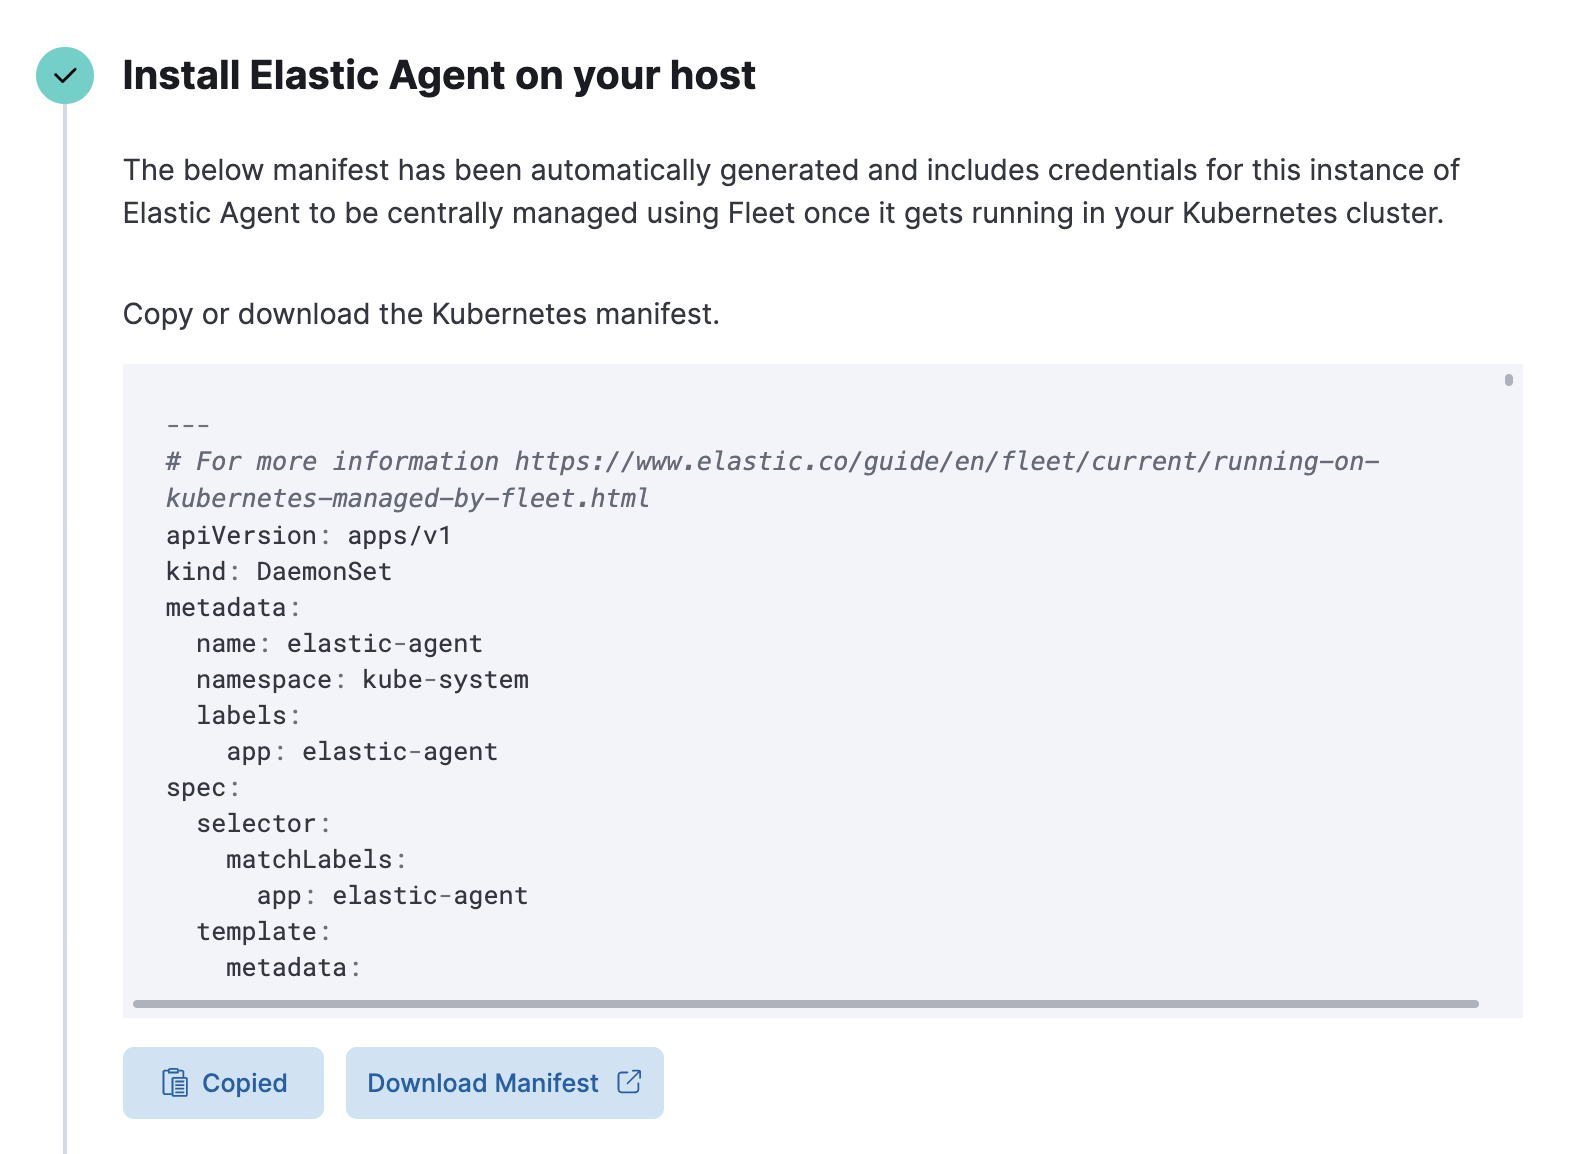
kubectl applyにより、Elastic AgentをKubernetesのデーモンセットとしてインストールします。
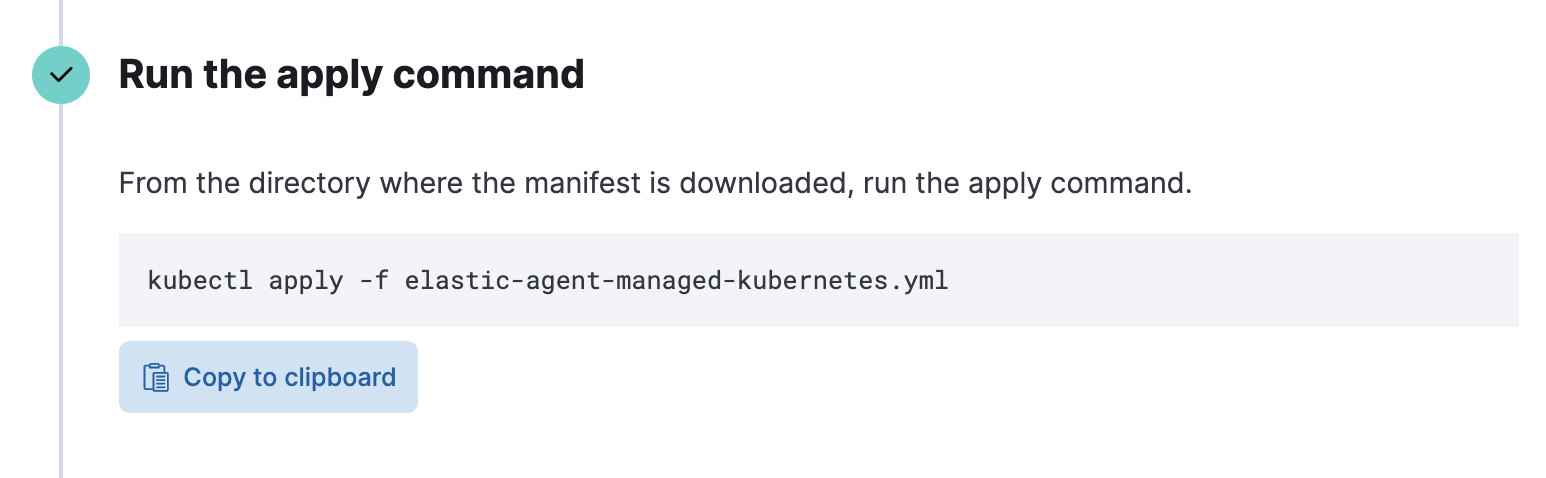
以下実行例です。GKEで実施しています。
$ kubectl apply -f elastic-agent-managed-kubernetes.yml
daemonset.apps/elastic-agent created
clusterrolebinding.rbac.authorization.k8s.io/elastic-agent created
rolebinding.rbac.authorization.k8s.io/elastic-agent created
rolebinding.rbac.authorization.k8s.io/elastic-agent-kubeadm-config created
clusterrole.rbac.authorization.k8s.io/elastic-agent created
role.rbac.authorization.k8s.io/elastic-agent created
role.rbac.authorization.k8s.io/elastic-agent-kubeadm-config created
serviceaccount/elastic-agent created
$ kubectl get pods -A
NAMESPACE     NAME                                                       READY   STATUS              RESTARTS        AGE
gmp-system    alertmanager-0                                             2/2     Running             0               3m56s
gmp-system    collector-kc25c                                            2/2     Running             0               2m37s
gmp-system    collector-krjtq                                            2/2     Running             0               2m36s
gmp-system    collector-zxgjx                                            2/2     Running             0               2m36s
gmp-system    gmp-operator-776c6b6b9c-46p5f                              1/1     Running             0               3m58s
gmp-system    rule-evaluator-6598d8965-qb5sg                             2/2     Running             1 (2m33s ago)   2m42s
kube-system   elastic-agent-l9gvg                                        0/1     ContainerCreating   0               40s
kube-system   elastic-agent-mbn9p                                        0/1     ContainerCreating   0               40s
kube-system   elastic-agent-wh66d                                        0/1     ContainerCreating   0               40s
kube-system   event-exporter-gke-7bf6c99dcb-zznm9                        2/2     Running             0               4m10s
kube-system   fluentbit-gke-2tcdb                                        2/2     Running             0               3m12s
kube-system   fluentbit-gke-q4l98                                        2/2     Running             0               3m11s
kube-system   fluentbit-gke-r27c9                                        2/2     Running             0               3m15s
kube-system   gke-metrics-agent-flbw7                                    2/2     Running             0               3m13s
kube-system   gke-metrics-agent-x9554                                    2/2     Running             0               3m13s
kube-system   gke-metrics-agent-xlpg4                                    2/2     Running             0               3m14s
kube-system   konnectivity-agent-68d8f95c98-7225f                        1/1     Running             0               2m45s
kube-system   konnectivity-agent-68d8f95c98-jsjjq                        1/1     Running             0               4m6s
kube-system   konnectivity-agent-68d8f95c98-n9ctt                        1/1     Running             0               2m45s
kube-system   konnectivity-agent-autoscaler-5d9dbcc6d8-8lv4v             1/1     Running             0               4m5s
kube-system   kube-dns-5bfd847c64-29qq5                                  4/4     Running             0               4m10s
kube-system   kube-dns-5bfd847c64-lt4gl                                  4/4     Running             0               2m46s
kube-system   kube-dns-autoscaler-84b8db4dc7-l4dp4                       1/1     Running             0               4m10s
kube-system   kube-proxy-gke-nobu-cluster-1-default-pool-d563ce5d-6kgg   1/1     Running             0               2m7s
kube-system   kube-proxy-gke-nobu-cluster-1-default-pool-d563ce5d-j6vw   1/1     Running             0               3m5s
kube-system   kube-proxy-gke-nobu-cluster-1-default-pool-d563ce5d-x5ds   1/1     Running             0               114s
kube-system   l7-default-backend-d86c96845-96glz                         1/1     Running             0               4m3s
kube-system   metrics-server-v0.5.2-6bf74b5d5f-xrb9q                     2/2     Running             0               2m41s
kube-system   pdcsi-node-94mln                                           2/2     Running             0               3m11s
kube-system   pdcsi-node-grntc                                           2/2     Running             0               3m14s
kube-system   pdcsi-node-vvw2r                                           2/2     Running             0               3m10s
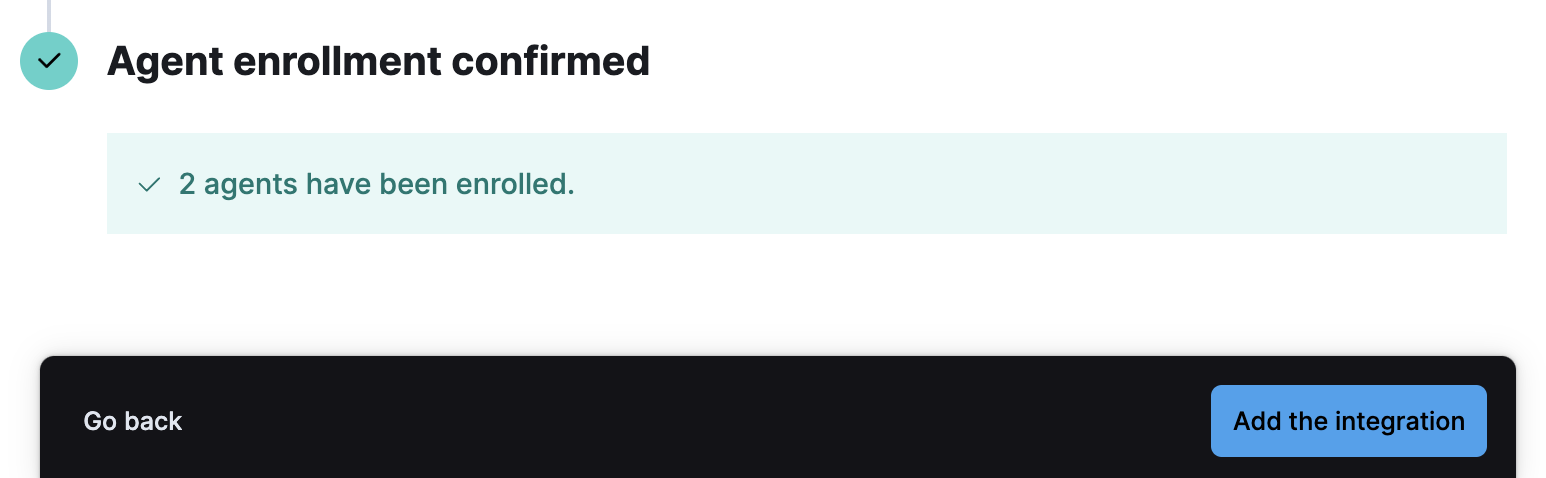
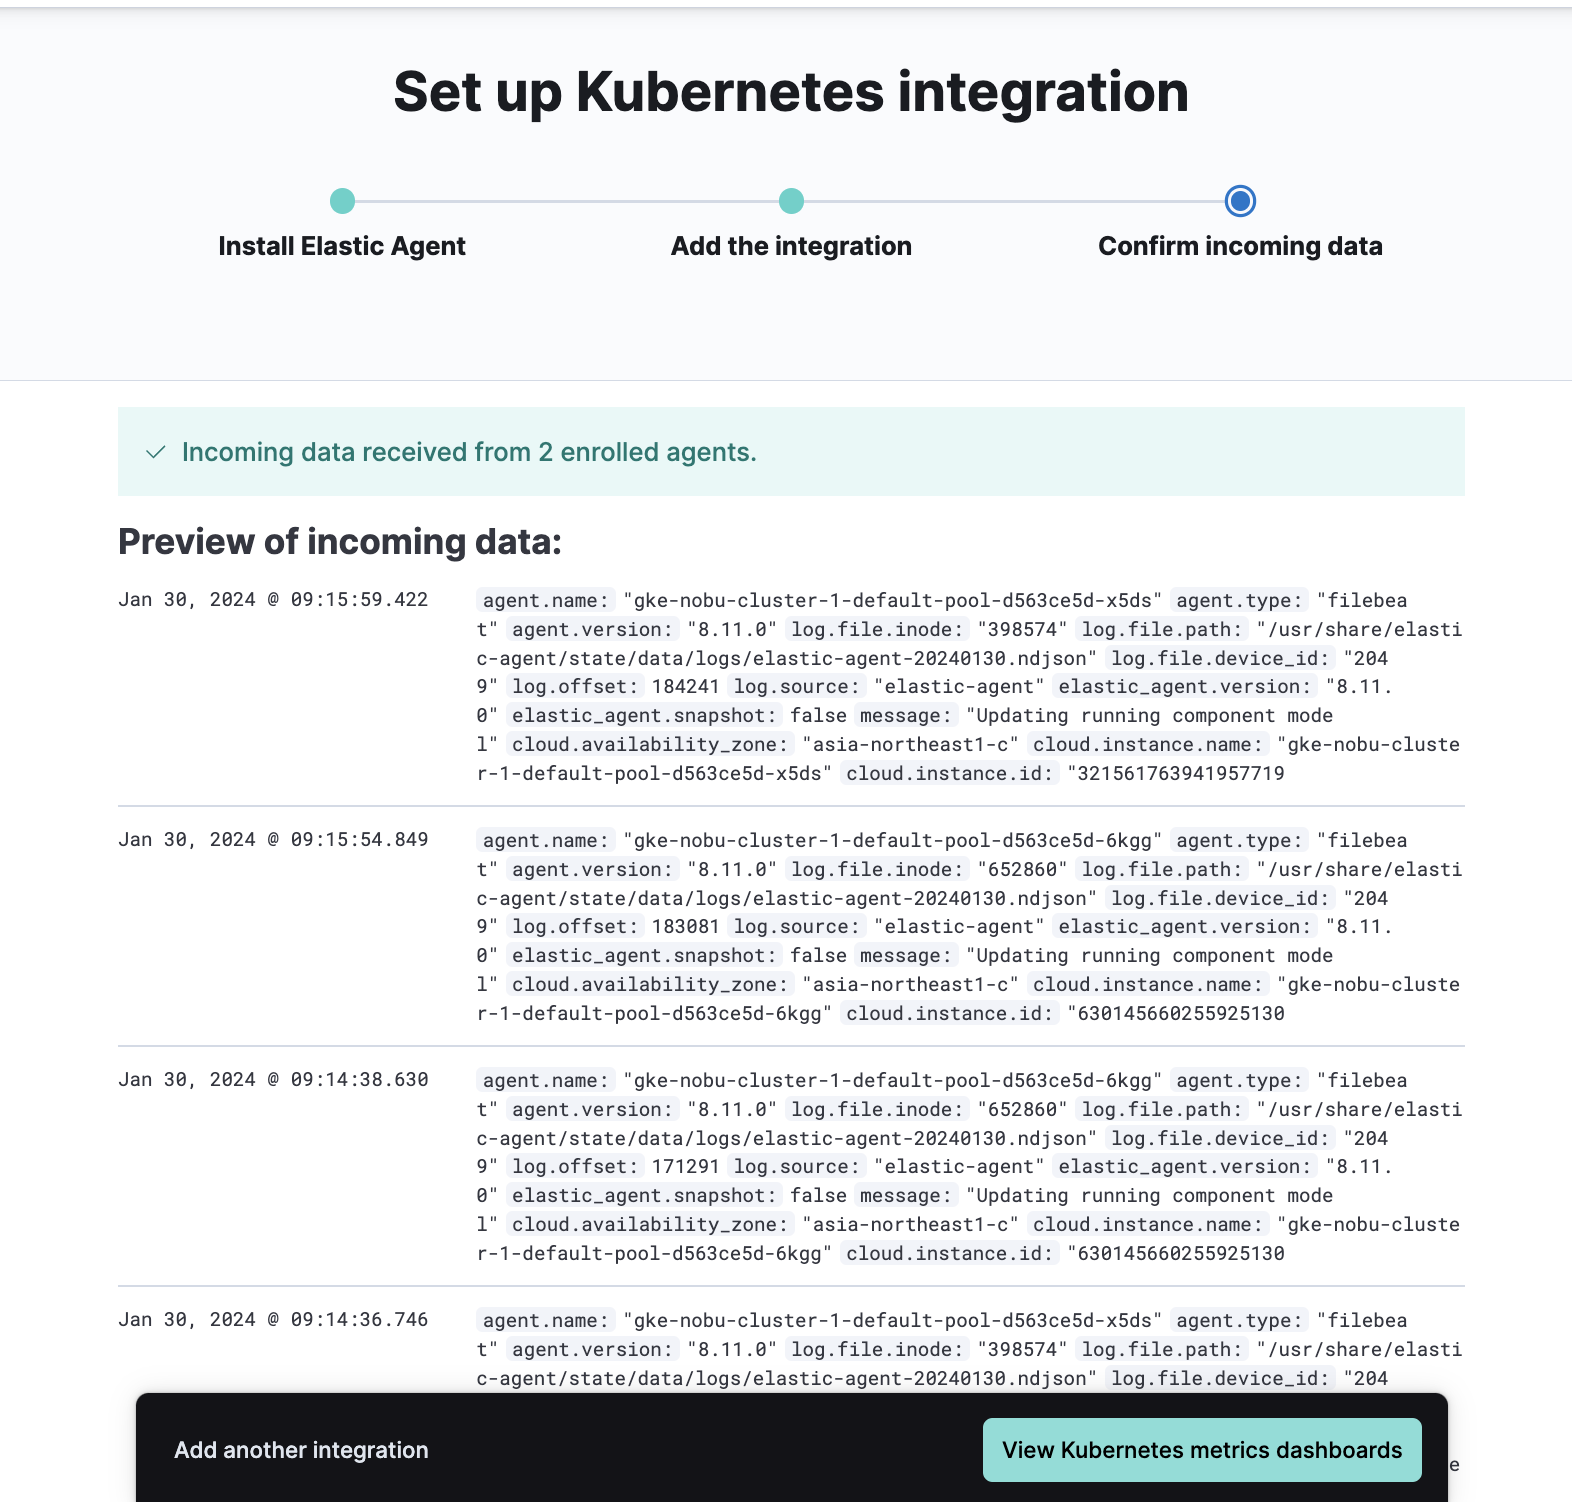
エージェントからのデータが上がってくると、このように表示されます。
Elastic Agentのインストールはできましたが、Kubernetesの監視設定はこれからです。次のステップとしてこの画面が表示されるので、監視項目を有効にします。今回はコンテナログだけ取得します。今回は有効にして、特にその他の追加設定なく保存します。

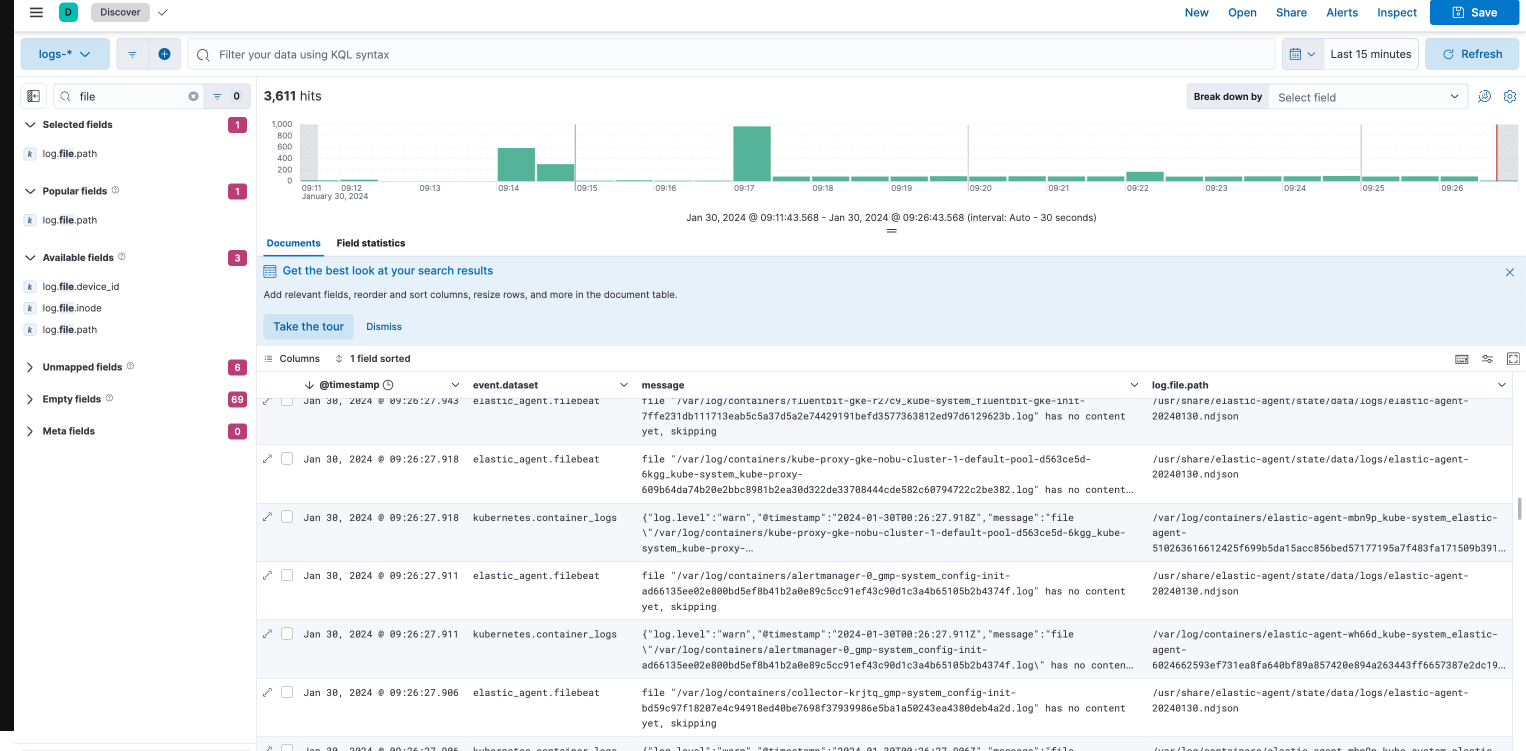
ログが収集されたら、このような画面となります。Elastic Agent自身のログもコンテナログとして収集されているのがわかります。
Discover画面を開き、logs-*ビューを開きましょう。見やすいようにフィールドの表示を設定します。messageフィルードにログメッセージが含まれています。
アプリケーションログの出力
SpringbootのJavaアプリを改変したものをKubernetesにデプロイし、kubectl logsコマンドで以下のようなJSON形式のログが出るようにしました。
{"@timestamp":"2024-01-31T06:57:14.761Z","@version":"1","message":"This is an error message.","logger_name":"com.example.springboot.HelloController","thread_name":"http-nio-8080-exec-10","level":"ERROR","level_value":40000}
{"@timestamp":"2024-01-31T06:57:15.220Z","@version":"1","message":"This is an informational message.","logger_name":"com.example.springboot.HelloController","thread_name":"http-nio-8080-exec-3","level":"INFO","level_value":20000}
{"@timestamp":"2024-01-31T06:57:15.223Z","@version":"1","message":"This is a warning message.","logger_name":"com.example.springboot.HelloController","thread_name":"http-nio-8080-exec-3","level":"WARN","level_value":30000}
{"@timestamp":"2024-01-31T06:57:15.226Z","@version":"1","message":"This is an error message.","logger_name":"com.example.springboot.HelloController","thread_name":"http-nio-8080-exec-3","level":"ERROR","level_value":40000}
{"@timestamp":"2024-01-31T06:57:15.776Z","@version":"1","message":"This is an informational message.","logger_name":"com.example.springboot.HelloController","thread_name":"http-nio-8080-exec-4","level":"INFO","level_value":20000}
{"@timestamp":"2024-01-31T06:57:15.776Z","@version":"1","message":"This is a warning message.","logger_name":"com.example.springboot.HelloController","thread_name":"http-nio-8080-exec-4","level":"WARN","level_value":30000}
{"@timestamp":"2024-01-31T06:57:15.776Z","@version":"1","message":"This is an error message.","logger_name":"com.example.springboot.HelloController","thread_name":"http-nio-8080-exec-4","level":"ERROR","level_value":40000}
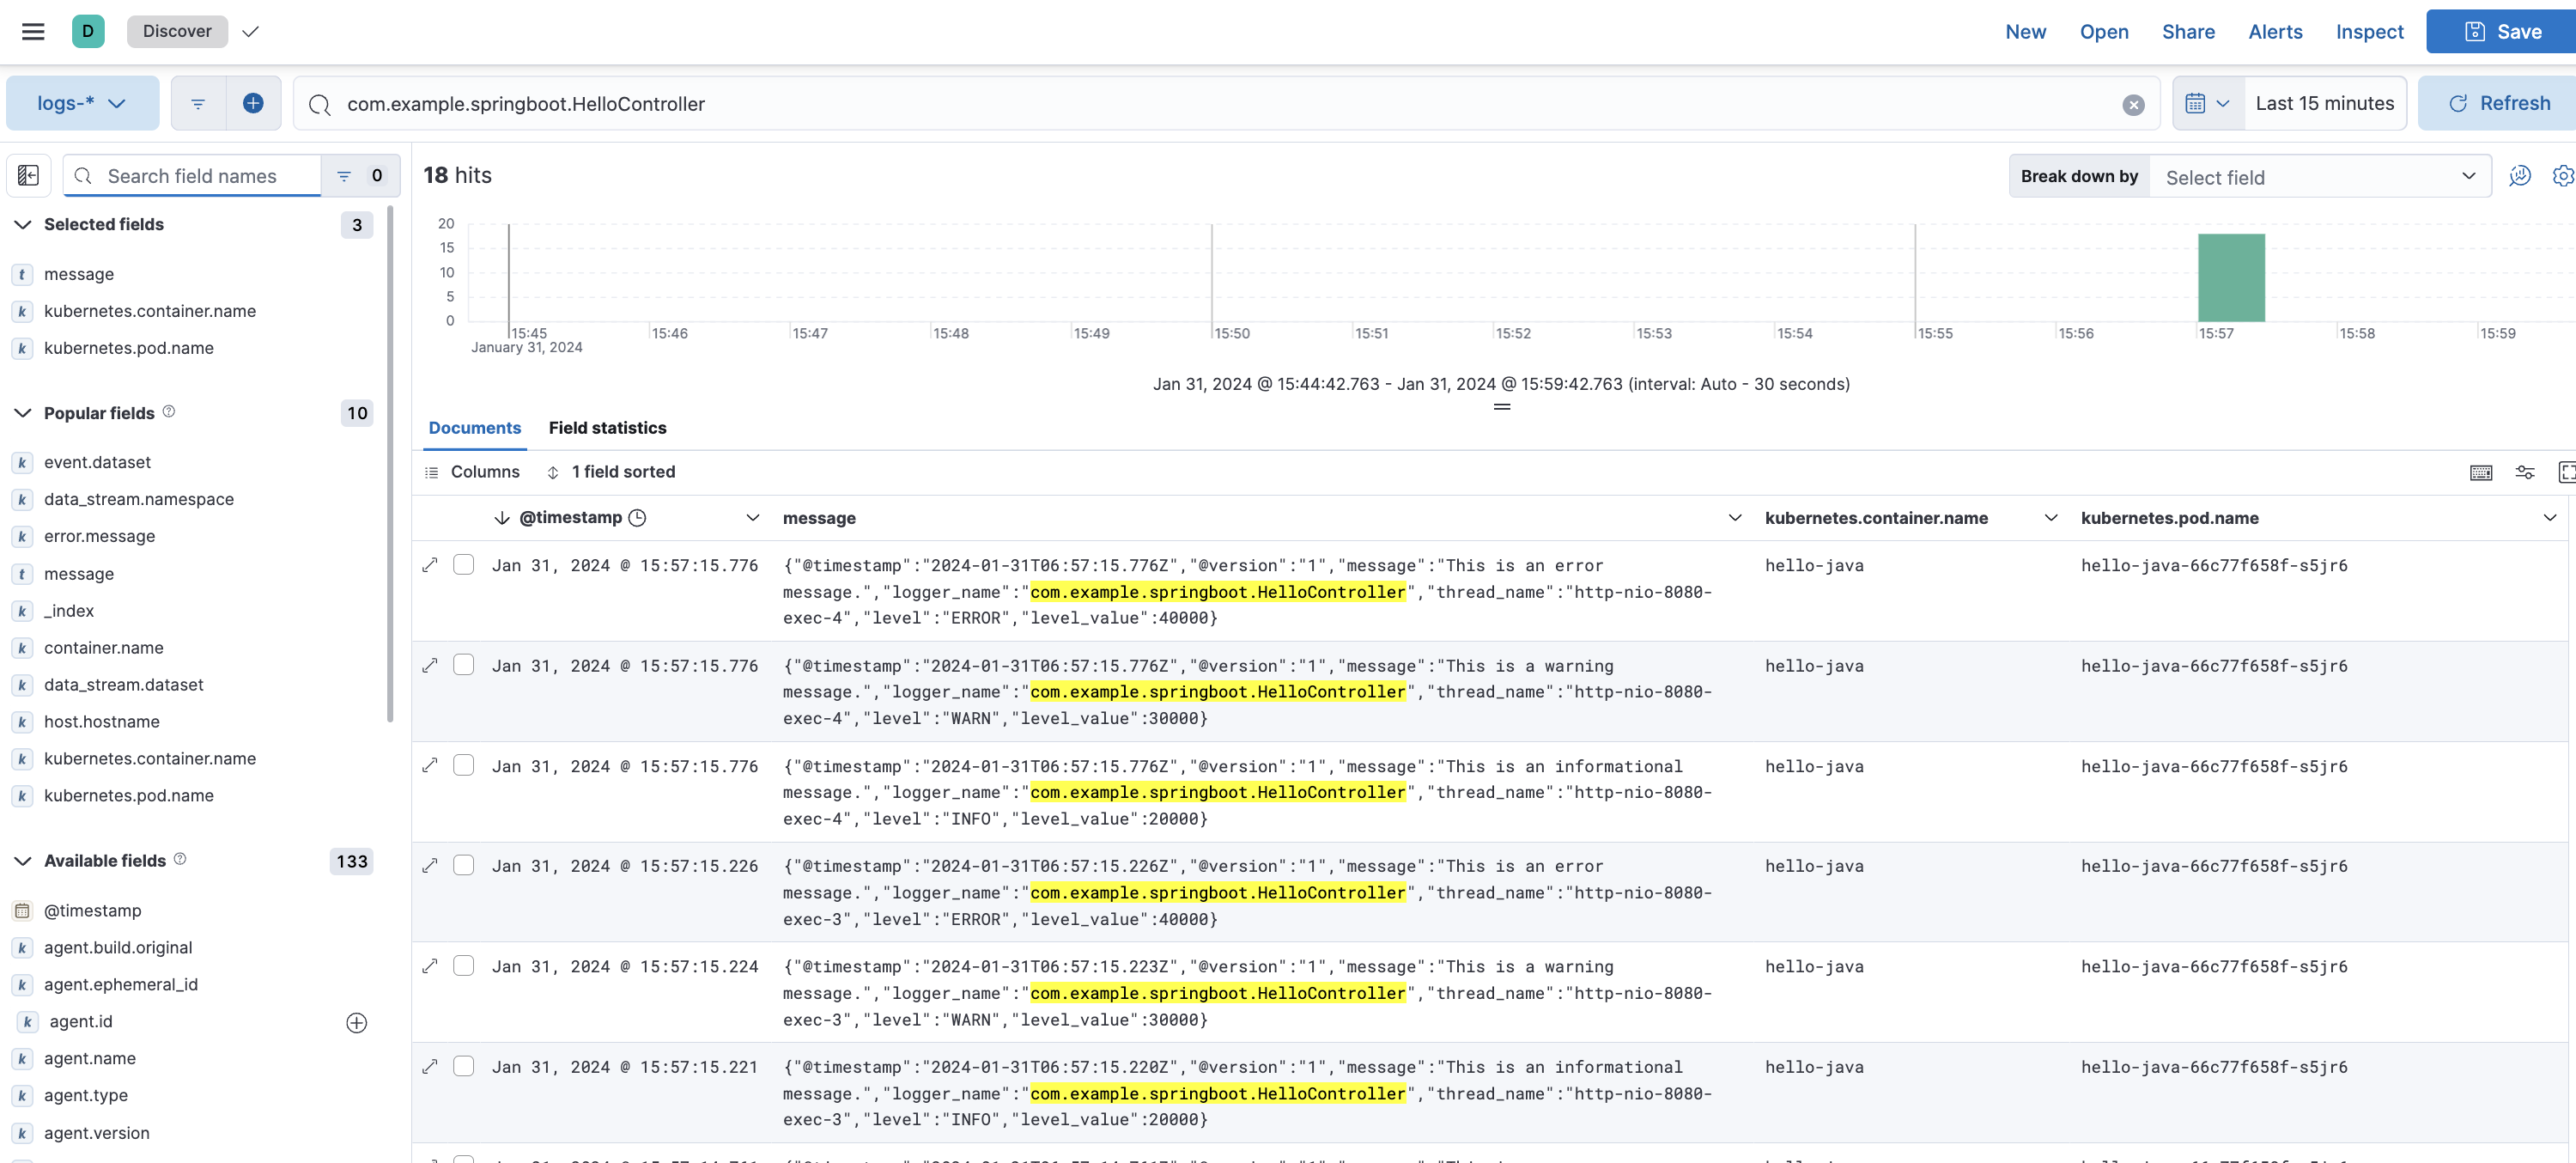
さきほどインストールしたElastic Agentにより、自動的にコンテナログは収集されるようになっています。このように、Podとコンテナの名前とともにログが確認できました。
コンテナログの収集設定をカスタマイズ
さきほど作成したIntegrationの設定を変更して、カスタマイズしていきます。カスタマイズにあたり、コンテナ種類毎に一つのIntegrationとなるように変更します。
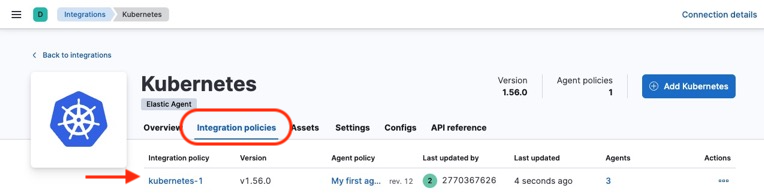
Kubernetes Integrationの画面に行き、Integration policiesタブを選択します。そして先ほど作成したIntegration policyをクリックします。
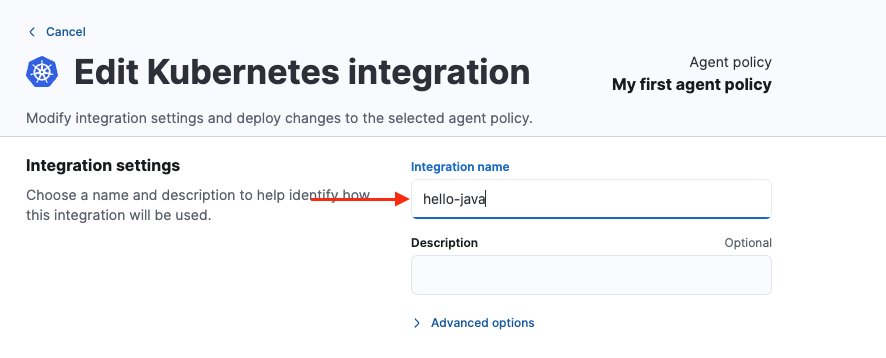
Integration nameを変更し、今回のコンテナを表すhello-javaと名付けました。
下にスクロールして、以下の設定変更を行います。

- hello-javaコンテナ専用のルールとするためにConditionを
${kubernetes.container.name} == "hello-java"と設定します。 - Dataset nameはhello-javaとします。これによりログ格納先を専用のインデックスにできます。
- Additional parsers configurationには以下のコードを追加します。これにより、元々messageフィールドに含まれるJSON形式のメッセージが、キーバリュー毎のフィールドに展開されたログとなります。パラメータについて詳しくはこちら。
 - ndjson:
     target: ""
     ignore_decoding_error: true
     message_key: message
最後、Save integrationボタンで保存します。 この設定はこれでElastic Agentに反映されます。
1分程度待てば変更が反映されたログがDiscoverで確認できます。表示したいカラムを選択していくと、ちゃんとJSONメッセージの中身をフィールドに分けることができました。

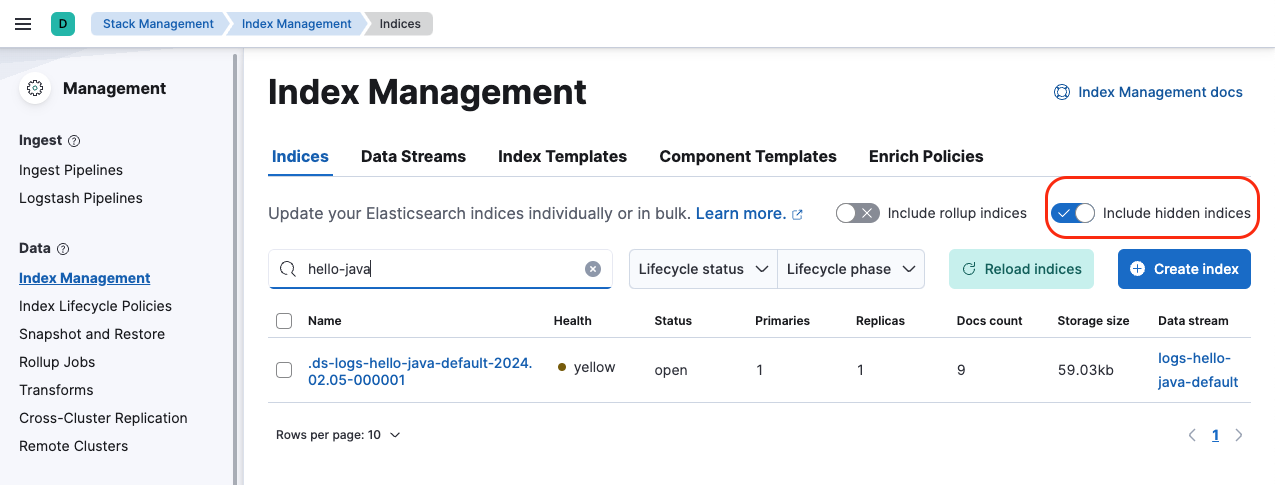
Stack Management配下のIndex Management画面から、必ずInclude hidden indicesを選択した上で、さきほど設定したDataset nameにあたるhello-javaを検索すると、予定通りインデックスとして分かれて、9個のログが保存されているのがわかります。
おわり
次回はNGINXログの場合について記事を書く予定です!