Pythonに付いているデフォルトGUIキットである,
tkInterのcanvasを使って,無理矢理wavの波形を描画してみます.
追加で必要なプラグインなどは一切ありません.
Pythonと,再生したい音源を用意するだけです.
※音源は「test.wav」を解析するように,以下のプログラムは組んであります.
python
# !/usr/bin/env python
# -*- coding: utf8 -*-
import sys
import Tkinter
import wave
import numpy as np

window_width = 600
window_height = 500

root = Tkinter.Tk()
root.title(u"Software Title")
root.geometry(str(window_width) + "x" + str(window_height))

# wavデータの読み込み
wav = wave.open("./test.wav")

# オーディオ部分の先頭に移動
wav.rewind()

# バイナリ読み込み
wavdata = wav.readframes(wav.getnframes())

# intに変換
wavdata = np.frombuffer(wavdata,'int16')


#
# キャンバスエリア
#
canvas = Tkinter.Canvas(root, width = window_width, height = window_height)

# X軸のステップ数
step = float(window_width)/float(wav.getnframes())
x = 0			# X軸
b_i = 0			# 一つ前の値

for c,i in enumerate(wavdata):
	# 一つ前の座標をおいておく
	if (c%2 == 0):
		b_i = i
		x = x + step
		continue

	# 一つ前の座標と,今回の座標を使って,波形グラフを作成
	canvas.create_line(int(x), (b_i/window_height)+(window_height/2), int(x+step), (i/window_height)+(window_height/2), fill = "blue")

	# X座標をstep分進める
	x = x + step
	print "(x,y) = ("+ str(x) +","+ str(i) +")"

# 中央線
canvas.create_line(0, window_height/2, window_width, window_height/2, fill = "black")


#
# キャンバスバインド
#
canvas.place(x=0,y=0)


#
# wavをクローズ
#
wav.close()

root.mainloop()
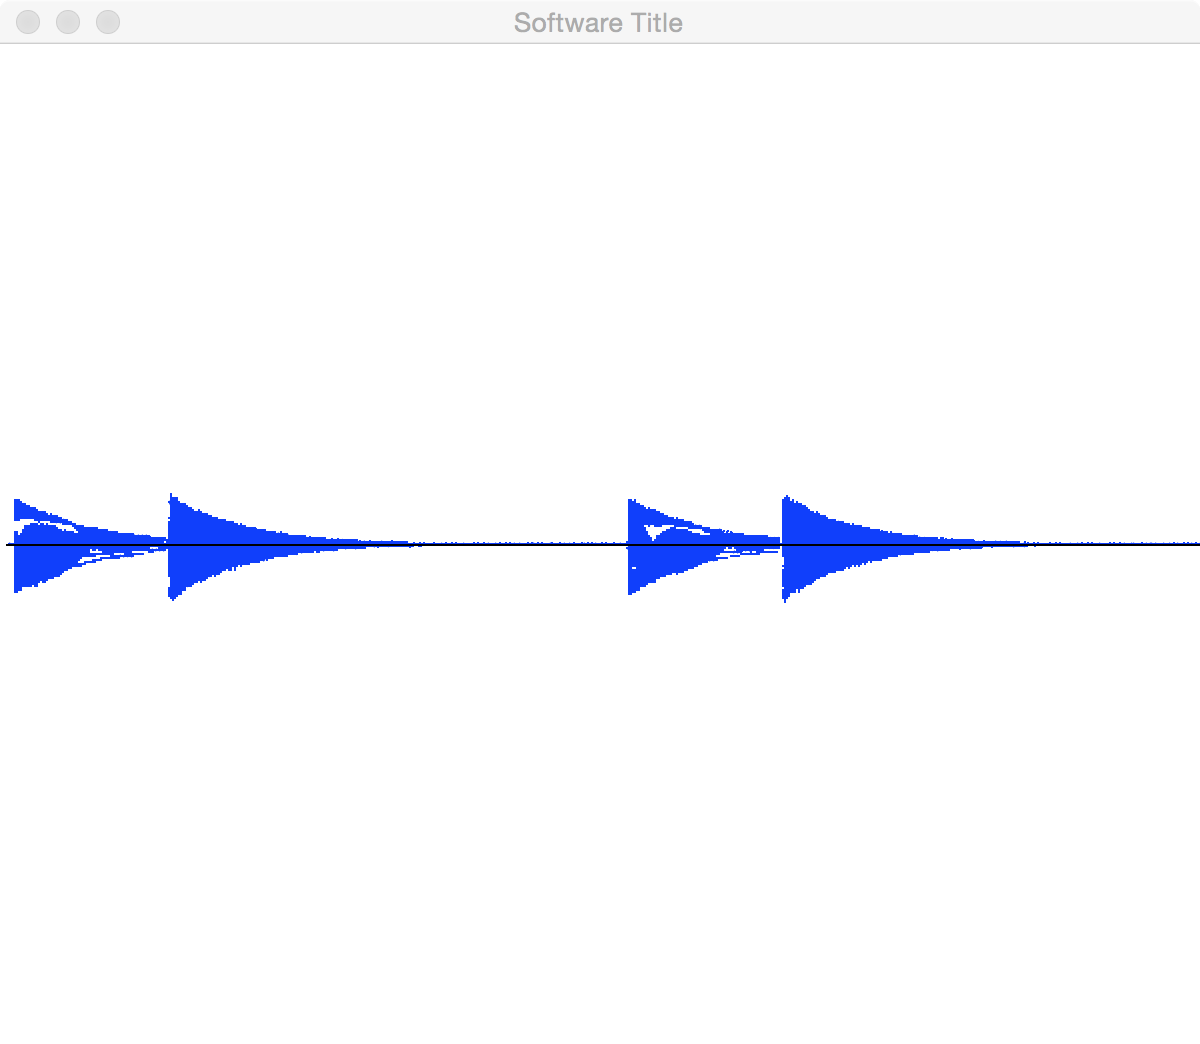
雑では有りますが,こんな感じで出力されます.