概要
- D3.js のラッパーライブラリ C3.js で折れ線グラフを描画する
- 環境: C3.js 0.7.15 + D3.js 5.15.1
C3.js と D3.js のダウンロード
Release v0.7.15 · c3js/c3 · GitHub から v0.7.15.zip をダウンロードして展開する。c3.css と c3.min.js を取り出す。
Release v5.15.1 · d3/d3 · GitHub から d3.zip をダウンロードして展開する。d3.min.js を取り出す。
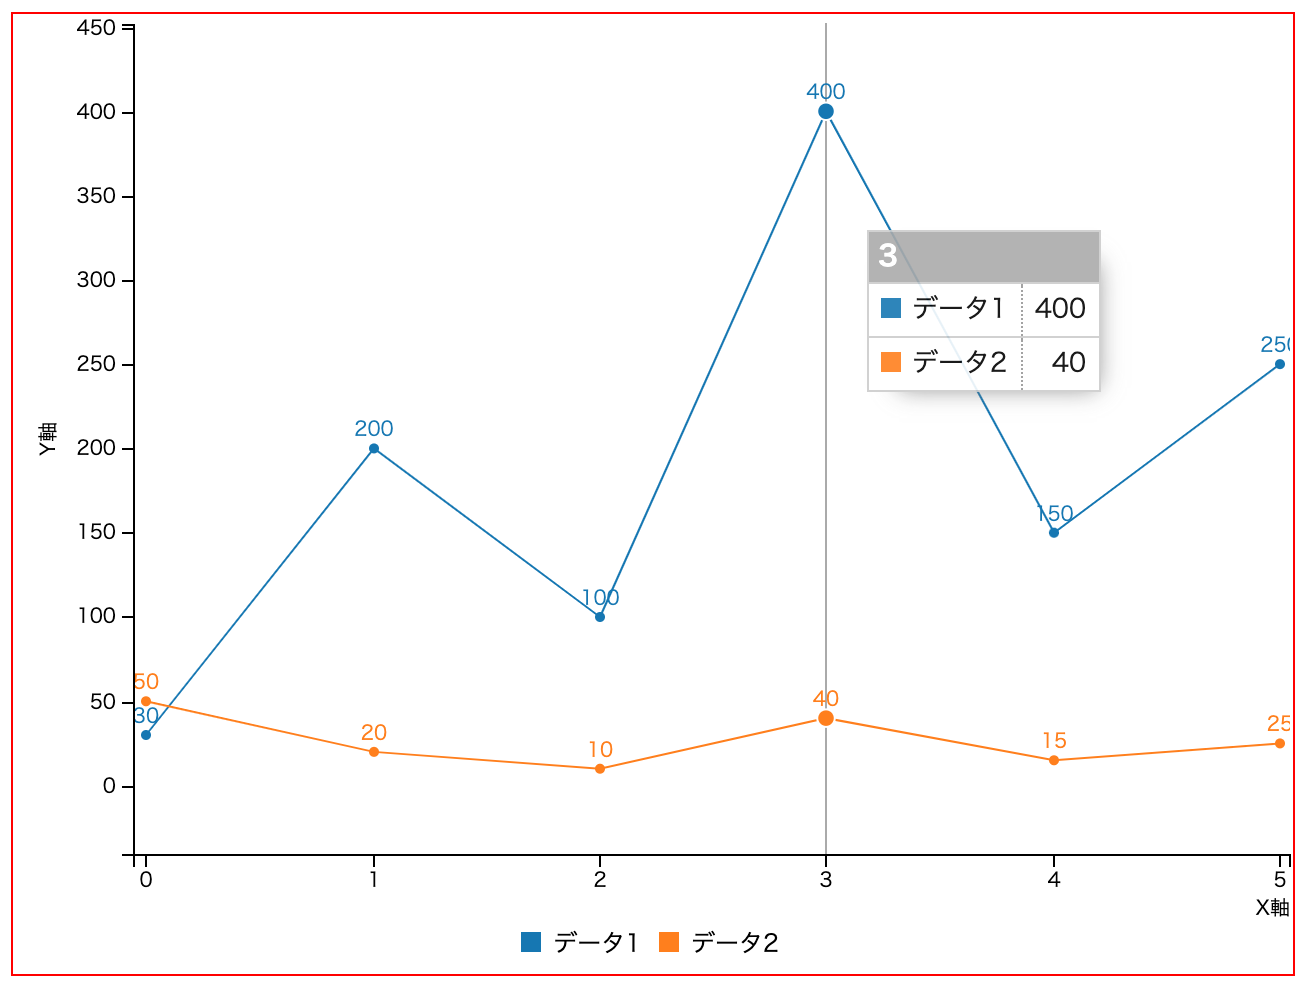
シンプルな折れ線グラフを描画するサンプル
<!DOCTYPE html>
<html lang="ja">
<head>
<meta charset="utf-8">
<title>C3.js で折れ線グラフを描画する</title>
<link href="c3.css" rel="stylesheet"><!-- c3.css を読み込む -->
</head>
<body>

<div id="my-container" style="width: 640px; height: 480px; border: solid 1px red">
  <div id="my-chart"></div>
</div>

<script src="d3.min.js"></script><!-- D3.js を読み込む -->
<script src="c3.min.js"></script><!-- C3.js を読み込む -->
<script>
let chart = c3.generate({
  bindto: '#my-chart',
  size: { width: 640, height: 480 }, // グラフ描画領域のサイズ
  data: {
    columns: [
      ['データ1', 30, 200, 100, 400, 150, 250],
      ['データ2', 50, 20, 10, 40, 15, 25]
    ],
    labels: true // それぞれの点に数値を表示
  },
  axis: {
    x: {
      label: {
        text: 'X軸',
        position: 'outer-middle'
      }
    },
    y: {
      label: {
        text: 'Y軸',
        position: 'outer-middle'
      }
    }
  }
});
</script>

</body>
</html>
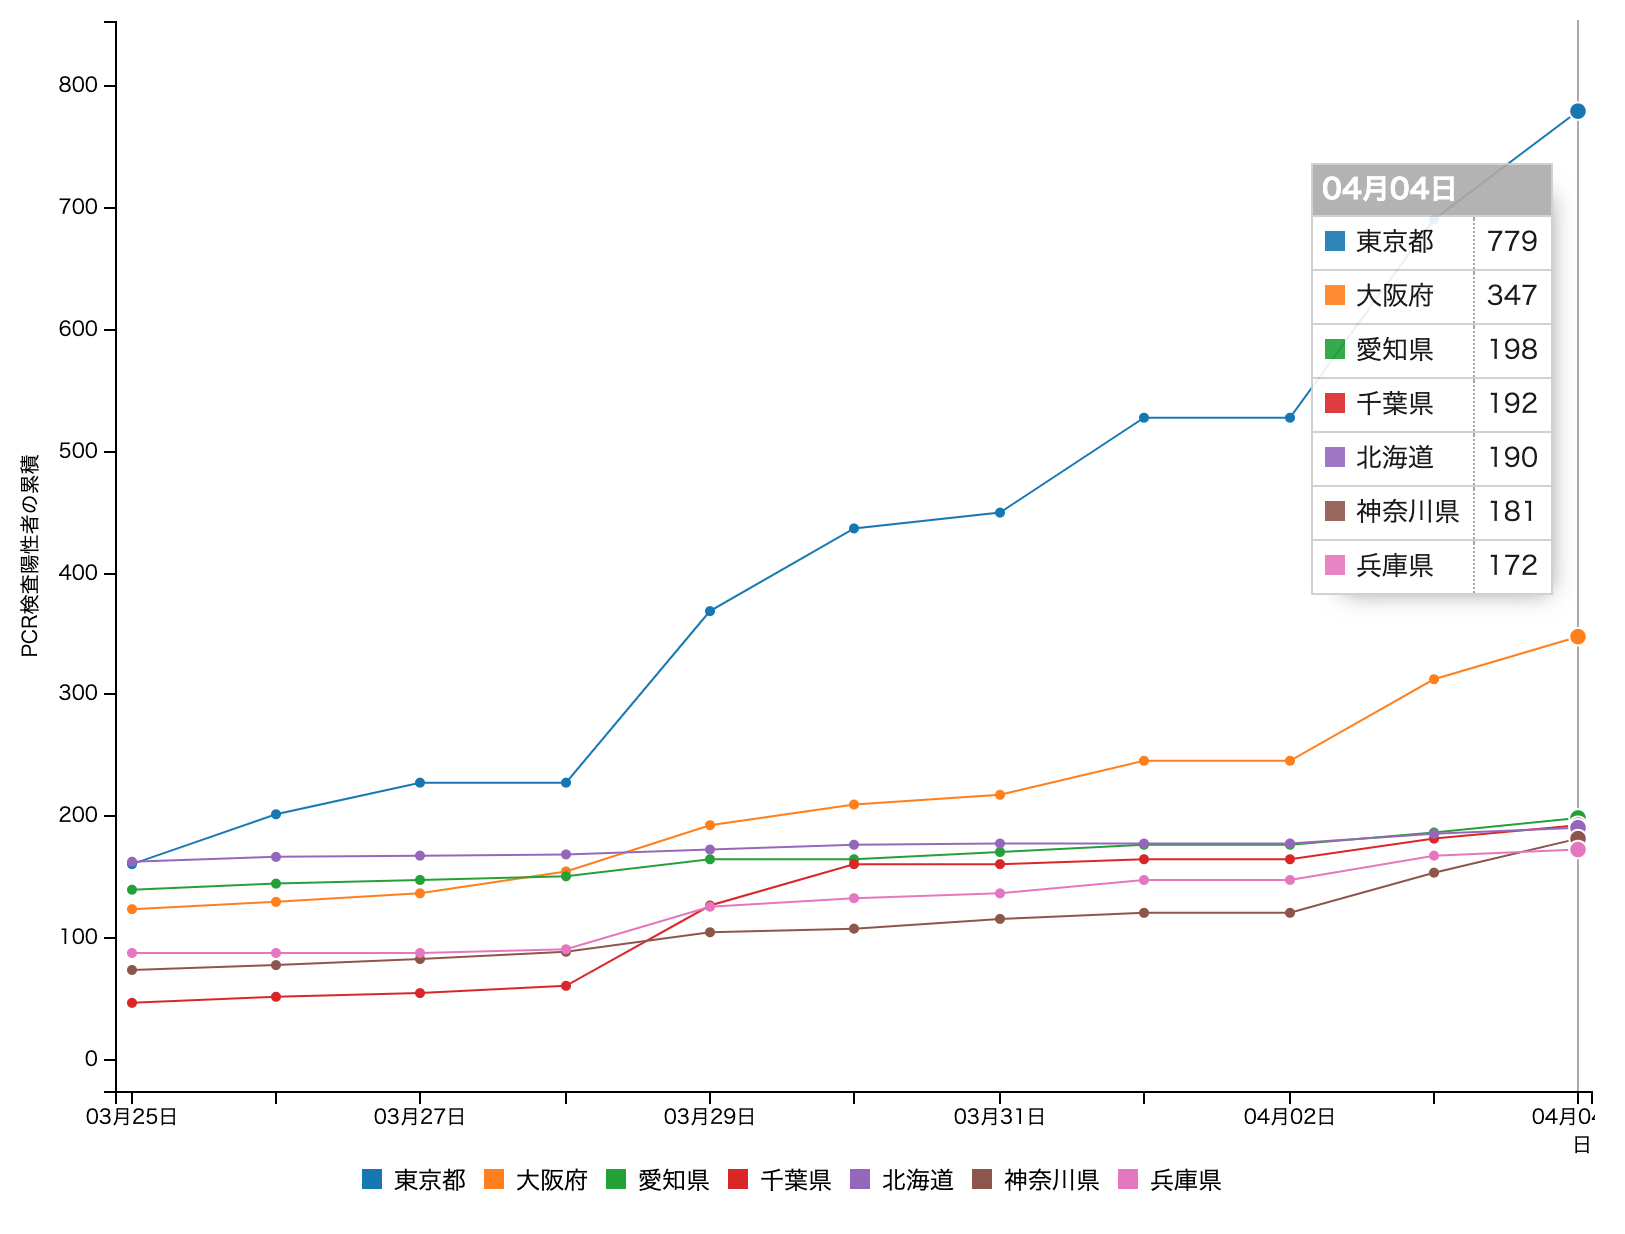
時系列データの折れ線グラフを描画するサンプル
<!DOCTYPE html>
<html lang="ja">
<head>
<meta charset="utf-8">
<title>都道府県別のPCR検査陽性者累積数</title>
<link href="c3.css" rel="stylesheet"><!-- c3.css を読み込む -->
</head>
<body>

<div id="my-chart"></div>

<script src="d3.min.js"></script><!-- D3.js を読み込む -->
<script src="c3.min.js"></script><!-- C3.js を読み込む -->
<script>
let chart = c3.generate({
  bindto: '#my-chart',
  size: { width: 800, height: 600 },
  data: {
    x: 'mydate', // 時系列インデックスの項目名
    xFormat: '%m%d', // 時系列インデックスの日付フォーマット
    columns: [
      ['mydate', '0325', '0326', '0327', '0328', '0329', '0330', '0331', '0401', '0402', '0403', '0404'],
      ['東京都', 160, 201, 227, 227, 368, 436, 449, 527, 527, 690, 779],
      ['大阪府', 123, 129, 136, 154, 192, 209, 217, 245, 245, 312, 347],
      ['愛知県', 139, 144, 147, 150, 164, 164, 170, 176, 176, 186, 198],
      ['千葉県', 46, 51, 54, 60, 126, 160, 160, 164, 164, 181, 192],
      ['北海道', 162, 166, 167, 168, 172, 176, 177, 177, 177, 185, 190],
      ['神奈川県', 73, 77, 82, 88, 104, 107, 115, 120, 120, 153, 181],
      ['兵庫県', 87, 87, 87, 90, 125, 132, 136, 147, 147, 167, 172],
    ]
  },
  axis: {
    x: {
      type: 'timeseries',
      tick: {
          format: '%m月%d日'
      },
      label: {
        text: '日',
        position: 'outer-middle'
      }
    },
    y: {
      label: {
        text: 'PCR検査陽性者の累積',
        position: 'outer-middle'
      }
    }
  }
});
</script>

</body>
</html>