Pythonで
データの操作にはPandasを使います。
import pandas as pd
Jupyterでの描画のためmatplotlibも使用します。
import matplotlib.pyplot as plt
%matplotlib inline
タイタニックのデータを読み込みます。Pandasのread_csvという関数でCSVファイルを取り込み、DataFrame型として保持します。
train = pd.read_csv("train.csv")
まずはデータの中身をざっと見てみます。
train.head()
| PassengerId | Survived | Pclass | Name | Sex | Age | SibSp | Parch | Ticket | Fare | Cabin | Embarked | |
|---|---|---|---|---|---|---|---|---|---|---|---|---|
| 0 | 1 | 0 | 3 | Braund, Mr. Owen Harris | male | 22.0 | 1 | 0 | A/5 21171 | 7.2500 | NaN | S |
| 1 | 2 | 1 | 1 | Cumings, Mrs. John Bradley (Florence Briggs Th... | female | 38.0 | 1 | 0 | PC 17599 | 71.2833 | C85 | C |
| 2 | 3 | 1 | 3 | Heikkinen, Miss. Laina | female | 26.0 | 0 | 0 | STON/O2. 3101282 | 7.9250 | NaN | S |
| 3 | 4 | 1 | 1 | Futrelle, Mrs. Jacques Heath (Lily May Peel) | female | 35.0 | 1 | 0 | 113803 | 53.1000 | C123 | S |
| 4 | 5 | 0 | 3 | Allen, Mr. William Henry | male | 35.0 | 0 | 0 | 373450 | 8.0500 | NaN | S |
Kaggleによると各項目の定義は以下のとおりです。
|Variable|Definition|Key/Remark|
|:--|:--|:--|:--|
|survival|Survival|0 = No, 1 = Yes|
|pclass|Ticket class|1 = 1st(Upper), 2 = 2nd(Middle), 3 = 3rd(Lower)|
|sex|Sex||
|Age|Age in years|Age is fractional if less than 1. If the age is estimated, is it in the form of xx.5|
|sibsp|# of siblings / spouses aboard the Titanic|Sibling = brother, sister, stepbrother, stepsister / Spouse = husband, wife (mistresses and fiancés were ignored)|
|parch|# of parents / children aboard the Titanic|Parent = mother, father / Child = daughter, son, stepdaughter, stepson / Some children travelled only with a nanny, therefore parch=0 for them.|
|ticket|Ticket number||
|fare|Passenger fare||
|cabin|Cabin number||
|embarked|Port of Embarkation|C = Cherbourg, Q = Queenstown, S = Southampton|
データの件数をカウントします。shape()で行数、列数を取得できます。全部で891行あります。
train.shape
(891, 12)
各列に欠損値がないかを、count()関数で確認します。Age, Cabinには欠損値があるようです。とくにCabinは欠損値が大半なので、変数としては使えなそうです。
train.count()
PassengerId    891
Survived       891
Pclass         891
Name           891
Sex            891
Age            714
SibSp          891
Parch          891
Ticket         891
Fare           891
Cabin          204
Embarked       889
dtype: int64
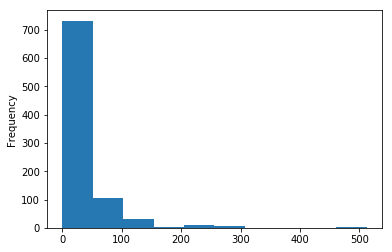
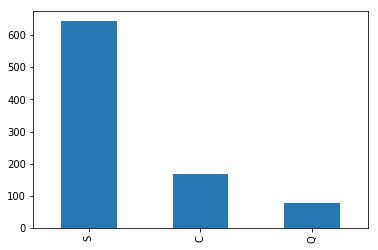
データの分布を可視化してみます。
train.Survived.value_counts().plot.bar()

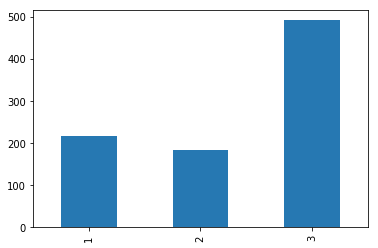
train.Pclass.value_counts().sort_index().plot.bar()
train.Sex.value_counts().plot.bar()

train.Age.plot.hist()

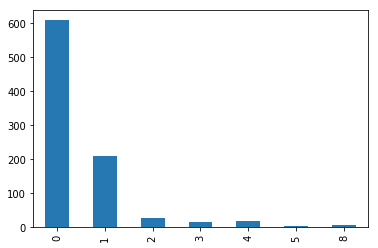
train.SibSp.value_counts().sort_index().plot.bar()
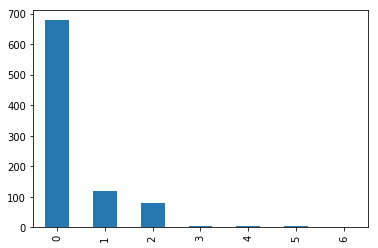
train.Parch.value_counts().sort_index().plot.bar()
train.Fare.plot.hist()
train.Embarked.value_counts().plot.bar()
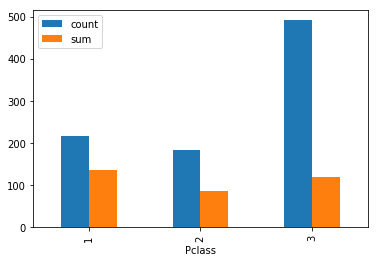
等級の高い(数字の小さい)船室の方が生存率が高い
train.groupby(["Pclass"]).agg(["count","sum"])["Survived"].plot.bar()
<matplotlib.axes._subplots.AxesSubplot at 0x10864b110>
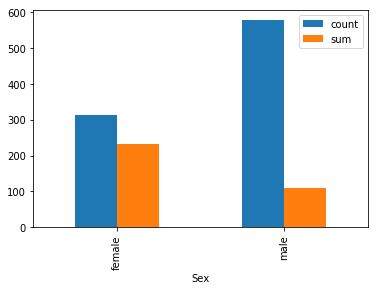
女性の方が生存率が高い
train.groupby(["Sex"]).agg(["count","sum"])["Survived"].plot.bar()
<matplotlib.axes._subplots.AxesSubplot at 0x10851b590>
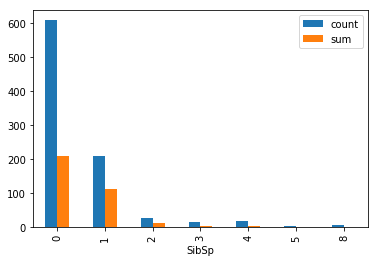
train.groupby(["SibSp"]).agg(["count","sum"])["Survived"].plot.bar()
<matplotlib.axes._subplots.AxesSubplot at 0x10921c690>
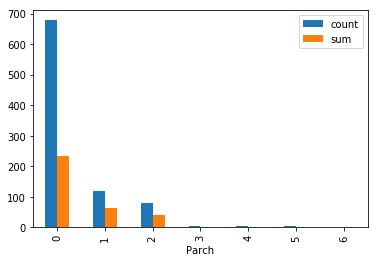
train.groupby(["Parch"]).agg(["count","sum"])["Survived"].plot.bar()
<matplotlib.axes._subplots.AxesSubplot at 0x10921c3d0>
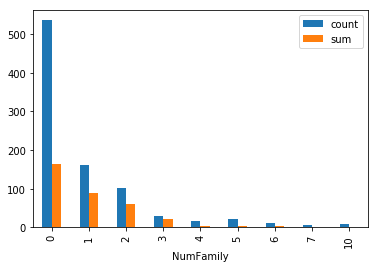
train["NumFamily"] = train["SibSp"] + train["Parch"]
train.groupby(["NumFamily"]).agg(["count","sum"])["Survived"].plot.bar()
<matplotlib.axes._subplots.AxesSubplot at 0x10a26e450>
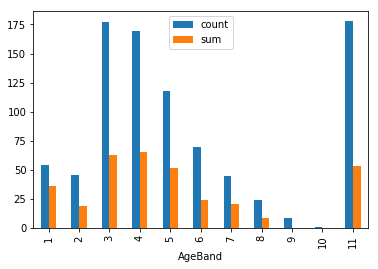
8歳未満は特に生存率が高い(AgeBand=6は欠損値)
import numpy as np
bins = np.histogram(
    train["Age"].fillna(train["Age"].median())
    ,bins=10)[1]
print bins
train["AgeBand"] = np.digitize(train["Age"],bins)
train.groupby(["AgeBand"]).agg(["count","sum"])["Survived"].plot.bar()
[  0.42    8.378  16.336  24.294  32.252  40.21   48.168  56.126  64.084
  72.042  80.   ]


<matplotlib.axes._subplots.AxesSubplot at 0x1090af0d0>
bins = np.histogram(
train["Fare"].fillna(train["Fare"].median())
,bins=10)[1]
print bins
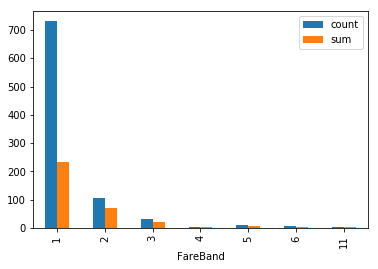
train["FareBand"] = np.digitize(train["Fare"],bins)
train.groupby(["FareBand"]).agg(["count","sum"])["Survived"].plot.bar()
[   0.        51.23292  102.46584  153.69876  204.93168  256.1646
  307.39752  358.63044  409.86336  461.09628  512.3292 ]


<matplotlib.axes._subplots.AxesSubplot at 0x1093adc10>