ネットワーク分析する際は、いつもjavascriptかpythonでnodeとedigeのjsonファイル(または.dotファイル)を作成してから、gephiを利用していたけど、pythonで完結できないかと思って検討した結果。
タイトルのとおり、pythonの3つのライブラリを連携させれば楽にネットワーク分析&可視化までできる。
中心となるnetworkxさまさま。おかげで苦労してきたデータ作成や出力などが一気に楽になった。
1.ネットワーク元のデータ
やはりpandasの利用。
networkxのドキュメントに「from_pandas_edgelist」という関数がある。
Parameters
df (Pandas DataFrame) – An edge list representation of a graph
source (str or int) – A valid column name (string or integer) for the source nodes (for the directed case).
target (str or int) – A valid column name (string or integer) for the target nodes (for the directed case).
edge_attr (str or int, iterable, True) – A valid column name (str or integer) or list of column names that will be used to retrieve items from the row and add them to the graph as edge attributes. If True, all of the remaining columns will be added.
create_using (NetworkX graph constructor, optional (default=nx.Graph)) – Graph type to
create. If graph instance, then cleared before populated.
pd.dataframeとして最低限、sourceとtargetという列さえ作ればネットワークを生成できる。
import networkx as nx
edges = pd.DataFrame({'source': [0, 1, 2],
               'target': [2, 2, 3],
               'weight':[1,1,1]})
G = nx.from_pandas_edgelist(edges, edge_attr=True)
edge_attrは、sourceとtarget以外の列をedgeの属性として読み込ませることができる。
(pandasの列で"color"とか"weight"とか作ればOK)
create_usingは、有向グラフを生成したい場合には
G = nx.from_pandas_edgelist(edges,edge_attr=True,create_using=nx.DiGraph())
と指定すればOK。最初無向グラフしか出せずに苦労した。
2.ネットワーク分析用のデータ生成&計算
上記のとおり、
G = nx.from_pandas_edgelist(edges, edge_attr=True)
でnetworkxの形式のデータを生成できる。簡単!
このデータさえ生成できれば、ネットワーク分析の指標を生成したり、
eigen_centrality = nx.eigenvector_centrality_numpy(G)
bet_centrality = nx.betweenness_centrality(G)
degree_centrality = nx.degree_centrality(G)
degree_coefficient = nx.clustering(G)
クラスタリングなど計算できる。
modu_class = nx.greedy_modularity_communities(G)
3.可視化
このままnetworkxで可視化するのもいいけど、よく納品形態として喜ばれるのがhtmlでの出力。
色々検討したが、pyvisというライブラリが良かった。
ほぼ可視化(html出力)のみに特化しているので、netoworkxとの相性もぴったし。
from pyvis.network import Network
pyvis_G = Network()
pyvis_G.from_nx(G)
pyvis_G.enable_physics(True)  #html上でレイアウト動かしたくない場合false
pyvis_G.show("mygraph.html")
でhtmlが生成されてブラウザで様子見れます。ズームイン/アウトとかも可。
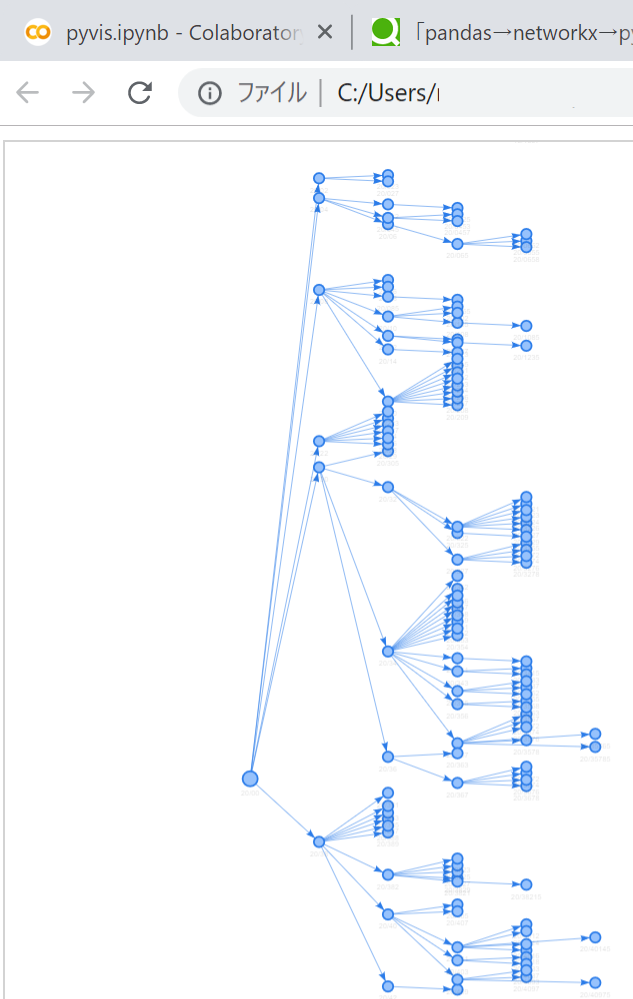
2000node~100000edgeでも可視化してくれて普通のPCでもちょっと工夫すればうまく動いてくれるので安心。ggplotも頭をよぎったけど、ネットワーク分析関係はこれで結構賄えそう。networkxありがたや。
4.その他
pandasからだとedgelistのみでnodeの属性は後から追加などしないといけないのが痛い。何かいい方法がないかな。
やり方分かったので今度書く予定。nodeの属性を辞書として入れれば良い。DBでいうjoinのような方法がありました。
後半へ