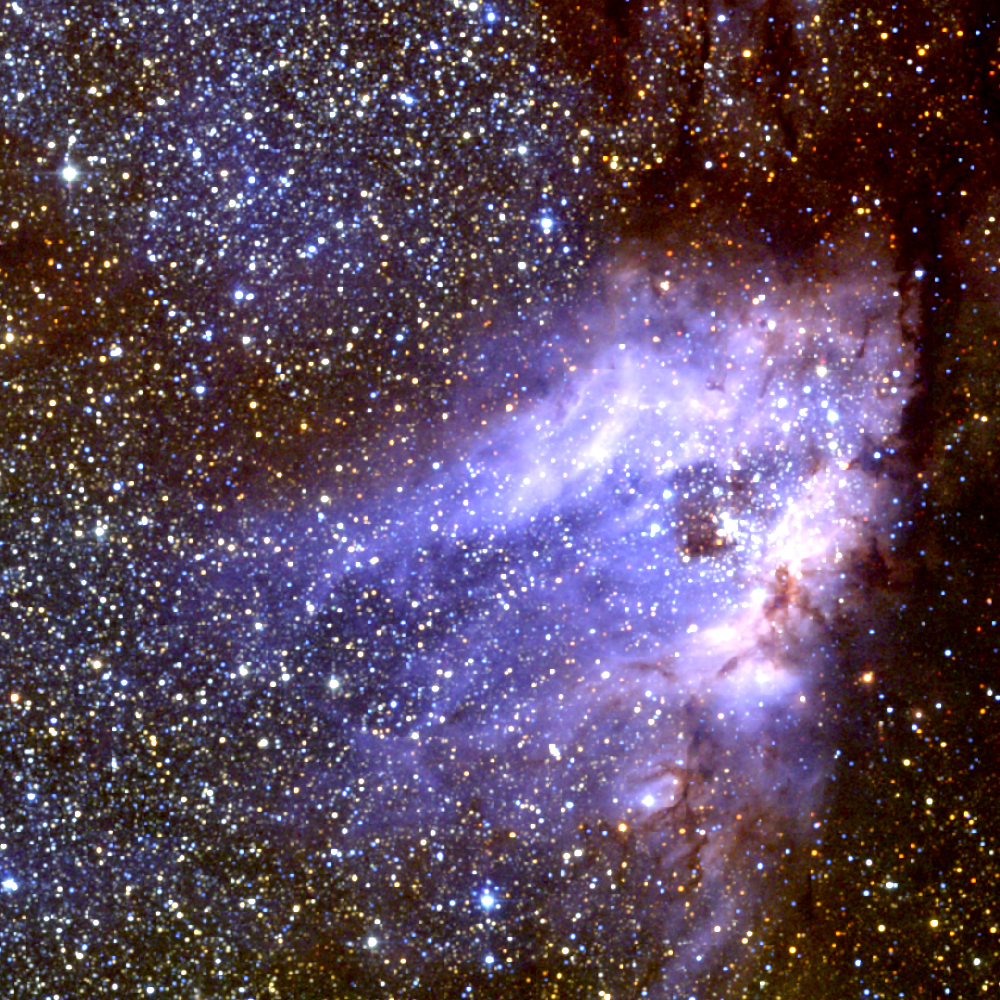
これは何か
天文でよく使われる 3 色合成図を python を使って作る方法を紹介します。
使うモジュール
- PIL
- astropy
- astroquery (画像データを python でダウンロードしたい場合必要)
目次
- Red, Green, Blue の 3 種類の画像を用意します
- PIL.Image を使って 3 色合成します
- rgbimage.py を使ってインタラクティブに 3 色合成図を作ります
1. 画像の準備
天文では FITS というファイルフォーマットで画像を管理しています。SkyView Virtual Observatory でダウンロードすることもできます。Web ブラウザからもダウンロードできますが、今回は python を使って自動でダウンロードしてみます。
コード
from astroquery.skyview import SkyView
import astropy.units

target = 'M17'
surveys = ['2MASS-J', '2MASS-H', '2MASS-K']
radius = 0.3 * astropy.units.deg
pixels = 1000

hdu = SkyView.get_images(target, surveys, radius=radius, pixels=pixels)
hdu[0].writeto('M17-2MASS-J.fits', clobber=True)
hdu[1].writeto('M17-2MASS-H.fits', clobber=True)
hdu[2].writeto('M17-2MASS-K.fits', clobber=True)
ちょっと紹介
M17 は、オメガ星雲として有名な散光星雲で、大質量星をたくさん含む NGC6618 クラスタが周囲の分子ガスを電離している領域です。天の川銀河の中でもかなり活発な大質量星形成領域です。
2MASS は近赤外線での全天サーベイ観測プロジェクトです。J バンド (1.2 μm)、H バンド (1.7 μm)、Ks バンド (2.2 μm) のデータが公開されています。
2. PIL.Image を使って 3 色合成図を作る
ダウンロードした 3 つのデータを使って、3 色合成図を作ります。
手順としては、
- FITS ファイルを読み込む
- min, max のレンジを決め、0 - 255 の int 型に変換する
- image を保存する
を行なっていきます。
コード
import numpy
import PIL.Image
import astropy.io.fits

r = astropy.io.fits.open('M17-2MASS-K.fits')[0].data[::-1,:]
g = astropy.io.fits.open('M17-2MASS-H.fits')[0].data[::-1,:]
b = astropy.io.fits.open('M17-2MASS-J.fits')[0].data[::-1,:]

pix_y, pix_x = r.shape


def scale(data, scale_min=None, scale_max=None, stretch='linear'):
    if stretch == 'linear':
        scale_func = scale_linear
    elif stretch == 'log':
        scale_func = scale_log
    else:
        scale_func = scale_linear
        pass

    if scale_min is None:
        scale_min = numpy.nanmin(data)
        pass

    if scale_max is None:
        scale_max = numpy.nanmax(data)
        pass

    scaled = scale_func(data, scale_min, scale_max)
    scaled = numpy.uint8(scaled * 255)
    return scaled

def scale_linear(data, scale_min, scale_max):
    print('%f, %f'%(scale_min, scale_max))
    scaled = (data - scale_min) / (scale_max - scale_min)
    scaled[numpy.where(scaled<0)] = 0
    scaled[numpy.where(scaled>=1)] = 1
    return scaled

def scale_log(data, scale_min, scale_max):
    print('%e, %e'%(scale_min, scale_max))
    scaled = scale_linear(data, scale_min, scale_max)
    scaled = numpy.log10((scaled * 9) + 1)
    return scaled


img = numpy.zeros([pix_y, pix_x, 3], dtype=numpy.uint8)
img[:,:,0] = scale(r, 630, 840, 'log')
img[:,:,1] = scale(g, 595, 730, 'log')
img[:,:,2] = scale(b, 150, 190, 'log')

PIL.Image.fromarray(img).save('rgbimage-M17-2MASS.png')
こんな画像が出てきます。
3. インタラクティブに 3 色合成図を作る
レンジを指定し、画像を確認し、またレンジを指定し、、、と繰り返しながら良い配色を探します。たくさん繰り返すと大変なので、GUI で操作できるツールを作りました。
使い方
- rgbimage.py をダウンロードして保存
- 実行する :
python rgbimage.py - ファイルをロードし、レンジを指定し、セーブする
- "Open" をクリックすると、ダイアログが開くので FITS ファイルを選びます
- "linear" と書かれたオプションメニュー : stretch を 'linear', 'log', 'sqrt' から選びます
- "min テキストボックス" : レンジ指定バーの下限値
- "max テキストボックス" : レンジ指定バーの上限値
- "min スライドバー" : 色レンジの最小を指定します
- "max スライドバー" : 色レンジの最大を指定します
最後に、"Save as" をクリックして画像を保存します。
4. 作った画像に座標をつける
astropy.wcs を使って matplotlib でプロットしてみます。
コード
import astropy.io.fits
import astropy.wcs
import astropy.units
import matplotlib.pyplot
import PIL.Image

matplotlib.rcParams['font.family'] = 'arial'

hdu = astropy.io.fits.open('M17-2MASS-K.fits')[0]
wcs = astropy.wcs.WCS(hdu.header)
img = PIL.Image.open('rgbimage-M17-2MASS.png')

fig = matplotlib.pyplot.figure()
ax = fig.add_subplot(111, projection=wcs)
ax.imshow(img)
ax.grid(color='w', linestyle='-')
ax.coords[0].set_major_formatter('hh:mm:ss')
ax.coords[1].set_major_formatter('dd:mm')
ax.set_xlabel('R.A. (J2000)')
ax.set_ylabel('Dec. (J2000)')

ax2 = ax.get_coords_overlay('galactic')
ax2[0].set_ticks(spacing=0.05*astropy.units.deg)
ax2[1].set_ticks(spacing=0.05*astropy.units.deg)
ax2[0].set_major_formatter('d.dd')
ax2[1].set_major_formatter('d.dd')
ax2[0].set_axislabel('Galactic Longitude')
ax2[1].set_axislabel('Galactic Latitude')
ax2.grid(color='y', linestyle='-')

fig.savefig('rgbimage-M17-2MASS-withcoord.png')


