目次
$\newcommand{\argmin}{\mathop{\rm arg~min}\limits}$
0. 初めに
- E資格検定の機械学習パートについてメモします。
- 各モデルについて、要件まとめ と 演習結果 を記載する。
1. 線形回帰
1-1. 要点まとめ
- 線形
- ざっくりいうと比例。
- $y = Ax+B$ (2次元)
- $z = Ax+By+C$ (3次元)
- $y = a_0 + a_1x_1 + a_2x_2 + \cdots + a_{n-1}x_{n-1} \\ \hspace{2mm} = a_0 + \sum_{i=1}^{n-1} a_i x_i \\ \hspace{2mm} = \sum_{i=0}^{n-1} a_i x_i, where \hspace{2mm} x_0=1 \\ \hspace{2mm} = \boldsymbol a^T \boldsymbol x $
- ざっくりいうと比例。
- 回帰問題
- ある入力(離散あるいは連続値)から出力(連続値)を予測する問題
- 直線で予測 ・・・ 線形回帰
- 曲線で予測 ・・・ 非線形回帰
- 回帰で扱うデータ
- 入力(説明変数、特徴量)
- m次元のベクトル
- 出力(目的変数)
- スカラー値
- 入力(説明変数、特徴量)
- ある入力(離散あるいは連続値)から出力(連続値)を予測する問題
- Vapnikの原理
- ある問題を解くとき、その問題より難しい問題を途中の段階で解いてはならないという原理
- 線形回帰モデル
- 回帰問題を解くための機械学習モデルの一つ
- 教師あり学習(教師データから学習)
- 入力とm次元パラメータの線形結合を出力するモデル
- 説明変数 $ \boldsymbol{x} = \Bigl( x_1,x_2,\cdots,x_m \Bigr)^T \in \mathbb{R}^m $ ※$\mathbb{R}$は実数全体の集合
- 目的変数 $y \in \mathbb{R}^1 $
- パラメータ $ \boldsymbol{w} = \Bigl( w_1,w_2,\cdots,w_m \Bigr)^T \in \mathbb{R}^m $
- 線形結合 $\hat{y} = \boldsymbol{w}^T \boldsymbol{x} + w_0 = \sum_{j=1}^m w_j x_j + w_0 $
- モデル数式
- $y=w_0 + w_1 x_1 + \epsilon$
- $\epsilon$:誤差(現在のモデルの説明力が不足している場合は誤差に入ってくる)
- $y=w_0 + w_1 x_1 + \epsilon$
- 連立方程式
- $\boldsymbol{y}=X \boldsymbol{w} + \boldsymbol{\epsilon}$
- $ \begin{pmatrix} y_1 \\ y_2 \\ \cdots \\ y_n \end{pmatrix} = \begin{pmatrix} 1 & x_{11} & \cdots & x_{1m} \\ 1 & x_{21} & \cdots & x_{2m} \\ \cdots & \cdots & \cdots & \cdots \\ 1 & x_{n1} & \cdots & x_{nm} \end{pmatrix} \begin{pmatrix} w_0 \\ w_1 \\ \cdots \\ w_m \end{pmatrix} + \begin{pmatrix} \epsilon_0 \\ \epsilon_1 \\ \cdots \\ \epsilon_n \end{pmatrix} $
- データの分割とモデルの汎化性能測定
- データの分割(学習用データ、検証用データに分割)
- 分割する目的
- 汎化性能を測定するため
- 学習データに対する当てはまりの良さだけでなく、未知のデータに対する精度を測定する
- 損失関数
- 平均二乗誤差(MSE)
- $\frac{1}{n} \sum_{i}^n ( \hat{y_i} - y_i )^2 = \frac{1}{n}\sum_{i} \mathcal{E}_i^2 $
- $\because \hat{y_i} = w_0 + w_i x_i \\ \hspace{5mm} y_i = w_0 + w_i x_i + \epsilon_i $
- 外れ値に弱い
- Huber損失、Tukey損失で対応
- $\hat{w} = \argmin_{w \in \mathbb{R^{m+1}}} \mbox{MSE}_{train} $
- MSEを最小にするようなw(m+1次元)
- $\frac{\partial}{\partial w} \mbox{MSE}_{train} = 0 $
- MSEをwに関して微分したものが0となるwの点を求める
- ⇒ $\frac{\partial}{\partial{\boldsymbol{w}}} \left\{\frac{1}{n_{train}} \sum_{i=1}^{n_{train}} \left( \hat{y}^{(train)} - y^{(train)} \right) ^2 \right\} = 0 $
- ⇒ $\frac{\partial}{\partial{\boldsymbol{w}}} \left\{\frac{1}{n_{train}} \sum_{i=1}^{n_{train}} \left( \boldsymbol{x}_i^{T} \boldsymbol{w}_i - y^{(train)} \right) ^2 \right\} = 0 $
- ⇒ $\frac{\partial}{\partial{\boldsymbol{w}}} \left\{\frac{1}{n_{train}} \left( X \boldsymbol{w} - \boldsymbol{y} \right)^T \left( X \boldsymbol{w} - \boldsymbol{y} \right) \right\} = 0 $
- ⇒ $\frac{\partial}{\partial{\boldsymbol{w}}} \left\{\frac{1}{n_{train}} \left( \boldsymbol{w}^T X^T - \boldsymbol{y}^T \right) \left( X \boldsymbol{w} - \boldsymbol{y} \right) \right\} = 0 $
- ⇒ $\frac{1}{n_{train}} \frac{\partial}{\partial{w}} \left\{ \boldsymbol{w}^T X^T X \boldsymbol{w} -2 \boldsymbol{w}^T X^T \boldsymbol{y} + \boldsymbol{y}^T \boldsymbol{y} \right\} = 0 $
- ⇒ $\frac{1}{n_{train}} \left\{ 2 X^T X \boldsymbol{w} -2 X^T \boldsymbol{y} \right\} = 0 \\ \because \frac{\partial(\boldsymbol{w}^T \boldsymbol{w})}{\partial{\boldsymbol{x}}} = \boldsymbol{x} \\ \frac{\partial(\boldsymbol{w}^T A \boldsymbol{w})}{\partial{\boldsymbol{w}}} = \left( A + A^T \right) \boldsymbol{x} \\ \hspace{17mm} = 2A \boldsymbol{x} \mbox{ (A:対称行列)} $
- ⇒ $2X^T X \boldsymbol{w} = 2X^T \boldsymbol{y} $
- ⇒ $\boldsymbol{\hat{w}} = \left( X^T X \right)^{-1} X^T \boldsymbol{y} $
- $\hat{y} = X_* \boldsymbol{\hat{w}} = X_* \left( X^T X \right)^{-1} X^T \boldsymbol{y} $
- 逆行列は常に存在するわけではない。(一般化逆行列などの対処がある)
- 平均二乗誤差(MSE)
1-2. 演習
- $\boldsymbol{\hat{w}} = \left( X^T X \right) ^{-1} X^T \boldsymbol{y} $ ・・・ の実装部分
# 多項式特徴ベクトル生成
def polynomial_features(xs, degree=3):
    X = np.ones((len(xs), degree+1))
    X_t = X.T #(100, 4)
    for i in range(1, degree+1):
        X_t[i] = X_t[i-1] * xs
    return X_t.T

# Xを生成
Phi = polynomial_features(xs)
# Inverse(X転置・X)・X転置の計算
Phi_inv = np.dot(np.linalg.inv(np.dot(Phi.T, Phi)), Phi.T)
# 上記・yの計算
w = np.dot(Phi_inv, ys)
- skitlearnを利用した回帰
- 説明変数をCHAS、RM、DIS、TAXに変更して予測してみた
# ライブラリインポート
from sklearn.datasets import load_boston
from pandas import DataFrame
import numpy as np
# ボストンデータを"boston"というインスタンスにインポート
boston = load_boston()
# DataFrame生成
df = DataFrame(data=boston.data, columns = boston.feature_names)
df['PRICE'] = np.array(boston.target)

# モデル生成等に必要なライブラリインポート
from sklearn.linear_model import LinearRegression
from sklearn.model_selection import train_test_split
from sklearn.metrics import mean_squared_error

# 目的変数[PRICE]~説明変数[CHAS、RM、DIS、TAX]で重回帰
## CHAS     Charles River dummy variable (= 1 if tract bounds river; 0 otherwise)
## RM       average number of rooms per dwelling
## DIS      weighted distances to five Boston employment centres
## TAX      full-value property-tax rate per $10,000
# 説明変数
X = df[['CHAS','RM','DIS','TAX']]
# 目的変数
y = df[['PRICE']].values

# Holdout法によるデータ分割(train70%、test30%とする)
X_train, X_test, y_train, y_test = train_test_split(X, y, test_size=0.3)
# 分割後のサイズを確認
print("X: %s, y: %s" % (X.shape, y.shape))
print("X_train: %s, y_train: %s" % (X_train.shape, y_train.shape))
print("X_test: %s, y_test: %s" % (X_test.shape, y_test.shape))
## X: (506, 4), y: (506, 1)
## X_train: (354, 4), y_train: (354, 1)
## X_test: (152, 4), y_test: (152, 1)

# LinearRegressionモデルのインスタンス生成
from sklearn.linear_model import LinearRegression
model = LinearRegression()
# トレーニング
model.fit(X_train, y_train)

# 予測(trainデータ)
y_pred_train = model.predict(X_train)
print('[train] MSE: %.3f 決定係数: %.3f' % (mean_squared_error(y_pred_train, y_train), (model.score(X_train, y_train))))
## [train] MSE: 35.391 決定係数: 0.537

# 予測(testデータ)
y_pred_test = model.predict(X_test)
print('[test] MSE: %.3f 決定係数: %.3f' % (mean_squared_error(y_pred_test, y_test), (model.score(X_test, y_test))))
## [test] MSE: 39.080 決定係数: 0.609
2. 非線形回帰
2-1. 要点まとめ
- 考え方
- 線形回帰: $y = w_0 + w_1 x_1 + w_2 x_2 + \cdots + w_n x_n $
- 非線形回帰:
- $e.g., \\ y = w_0 + w_1 x + w_2 x^2 + w_3 x^3 \\ y = w_0 + w_1 \sin{x} + w_2 \cos{x} + w_3 \log{x} $
- $xの代わりに、xの関数である\phi(x)を用いる $
- $xから\phi(x)に代えても、wについては線形のまま$
- 予測モデル
- $\hat{y} = w_0 + w_1 \phi_1(x) + w_2 \phi_2(x) + \cdots + w_n \phi_n(x)$
- xを非線形にしただけで、重みwについて線形(linear-in-parameter)
- 線形モデルによる非線形回帰という表現が正しい
- 基底展開法
- 回帰関数として、既定関数と呼ばれる既知の非線形関数とパラメータベクトルの線形結合
- 未知パラメータは線形回帰モデルと同様に最小二乗法や最尤法による推定
- $y_i = f(x_i) + \epsilon_i \hspace{10mm} y_i = w_0 + \sum_{j=1}^m w_j \phi_j(x_i) + \epsilon_i $
- よく使われる基底関数
- 多項式関数
- $\phi_j = x^j を考える$ ※今回はj=9で考える
- $\hat{y} = w_0 + w_1 \phi_1(x_i) + w_2 \phi_2(x_i) + \cdots + + w_9 \phi_9(x_i) \\ \hspace{3mm} = w_0 + w_1 x_i + w_2 x_i^2 + \cdots + w_9 x_i^9 $
- ガウス型基底関数
- $\phi_j(x) = \exp \left\{ - \frac{(x-u_j)^2}{2h_j} \right\} = \exp \left\{ - \frac{(x-u_j)^2}{\sigma^2} \right\}$
- 例えばj=2で考える
- $平均u_1とu_2をもつ、2個のガウス曲線がある。$
- $そのガウス曲線の広がりを2h_jや\sigma^2でコントロールする。$
- スプライン関数 / Bスプライン関数
- 多項式関数
- 基底展開法も線形回帰と同じ枠組みで推定可能
- $\boldsymbol{\hat{w}} = \left( X^T X \right)^{-1} X^T \boldsymbol{y} ⇒ \boldsymbol{\hat{w}} = \left( \Phi^T \Phi \right)^{-1} \Phi^T \boldsymbol{y} \\ \therefore \boldsymbol{\hat{y}} = \Phi_* \boldsymbol{\hat{w}} = \Phi_* \left( \Phi^T \Phi \right)^{-1} \Phi^T \boldsymbol{y} $
- 未学習と過学習
- 未学習
- 学習データに対して、十分小さな誤差が得られないモデル
- 過学習
- 学習データに対して過度にフィットしてしまう。汎化性能に問題がある状態。
- オッカムの剃刀
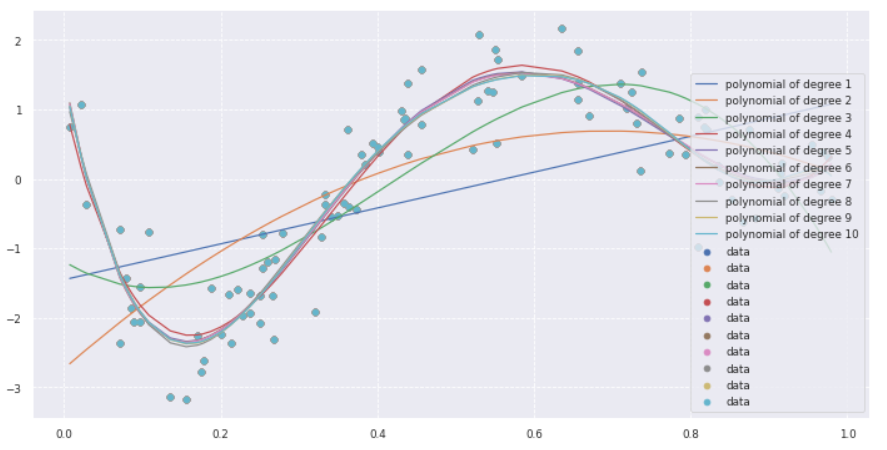
- 4次関数以上はほぼ同じ。であるならば、それ以上高次にしても無意味であり害が発生する。
- 対策
- 学習データの数を増やす
- 不要な基底関数(変数)を削除して表現力を抑止
- どこまで削るかは難しい。ドメイン知識、AICによる変数選択。
- 正則化法を利用して表現力を抑止
- 「モデルの複雑さに伴って、その値(=w)が大きくなる正則化項(罰則項)を課した関数」を最小化
- $\boldsymbol{\hat{w}} が大きくなりすぎないようにする。$
- $\hat{y} = X_* \boldsymbol{\hat{w}} = X_* \left( X^T X \right)^{-1} X^T \boldsymbol{y} $
- $逆行列が存在しないとき、平行に近い時に \boldsymbol{\hat{w}} が大きくなる。$
- $X = \begin{pmatrix} 1 & 2 & 4 \\ 1 & 3 & 5.9 \\ 1 & 4 & 8.1 \end{pmatrix} ⇒ \left( X^T X \right)^{-1} の要素は大きくなる。 $
- $E(\boldsymbol{w}) = J(\boldsymbol{w}) + \lambda \boldsymbol{w}^T \boldsymbol{w} $
- $J(\boldsymbol{w}) \cdots \mbox{MSE}$
- $\lambda \boldsymbol{w}^T \boldsymbol{w} \cdots \mbox{罰則項} $
- (最適化): KKT条件より、罰則項をつけることで不等式条件を回避できる。
- 正則化項の役割
- なし: 最小二乗推定量
- L2ノルムを利用: Ridge推定量(パラメータを0に近づけるよう推定)
- L1ノルムを利用: Lasso推定量(いくつかのパラメータを正確に0に推定)
- 正則化パラメータの役割
- 小さい場合 ⇒ 制約面が大きくなる
- 大きい場合 ⇒ 制約面が小さくなる
- データの分割・評価
- ホールドアウト
- 学習データで学習しつつ、テストデータで予測精度をチェックする。
- データを1回で2つに分けてしまう。データが多くないといけない。
- 欠点
- 外れ値が学習用データに入ると、外れ値にフィッティングしてしまう。
- クロスバリデーション(交差検証)
- 学習データとテストデータを交互に切り替えながら複数回フィッティングする。
- 精度評価は、各モデルの結果の平均を行う。
- 外れ値の影響を受けづらい。複数モデルの精度の平均で評価するため。
- ホールドアウト
- ハイパーパラメータチューニング
- グリッドサーチ
- チューニングパラメータの組合せで評価値を算出
- ランダムサーチ
- ベイジアン最適化
- グリッドサーチ
- 未学習
2-2. 演習
- 事前準備
import numpy as np
import matplotlib.pyplot as plt
import seaborn as sns
%matplotlib inline
# seaborn設定
sns.set()
# 背景変更
sns.set_style("darkgrid", {'grid.linestyle': '--'})
# 大きさ(スケール変更)
sns.set_context("paper")
n=100
def true_func(x):
    z = 1-48*x+218*x**2-315*x**3+145*x**4
    return z
def linear_func(x):
    z = x
    return z
- データ生成
# 真の関数からノイズを伴うデータを生成

# 真の関数からデータ生成
data = np.random.rand(n).astype(np.float32)
data = np.sort(data)
target = true_func(data)

#  ノイズを加える
noise = 0.5 * np.random.randn(n)
target = target  + noise

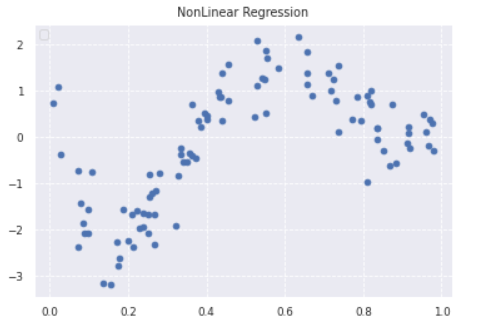
# ノイズ付きデータを描画
plt.scatter(data, target)
plt.title('NonLinear Regression')
plt.legend(loc=2)
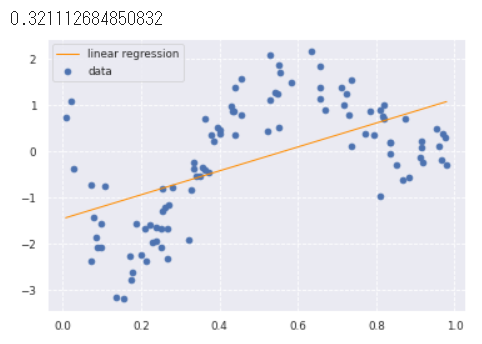
- 線形回帰 ⇒ フィットしていない(決定係数0.32と低い)
from sklearn.linear_model import LinearRegression

clf = LinearRegression()
data = data.reshape(-1,1)
target = target.reshape(-1,1)
clf.fit(data, target)

p_lin = clf.predict(data)

plt.scatter(data, target, label='data')
plt.plot(data, p_lin, color='darkorange', marker='', linestyle='-', linewidth=1, markersize=6, label='linear regression')
plt.legend()
print(clf.score(data, target))
-
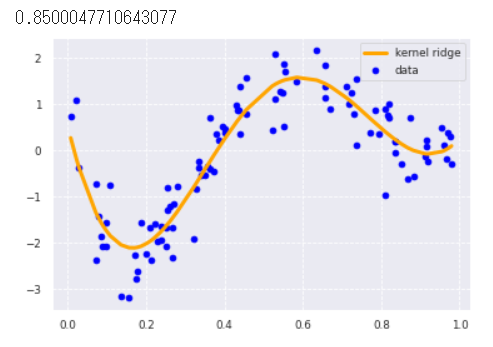
KernelRidge
- L2正則付き最小二乗学習(linear least squares with l2-norm regularization)
from sklearn.kernel_ridge import KernelRidge

clf = KernelRidge(alpha=0.0002, kernel='rbf')
clf.fit(data, target)

p_kridge = clf.predict(data)

plt.scatter(data, target, color='blue', label='data')

plt.plot(data, p_kridge, color='orange', linestyle='-', linewidth=3, markersize=6, label='kernel ridge')
plt.legend()
print(clf.score(data, target))
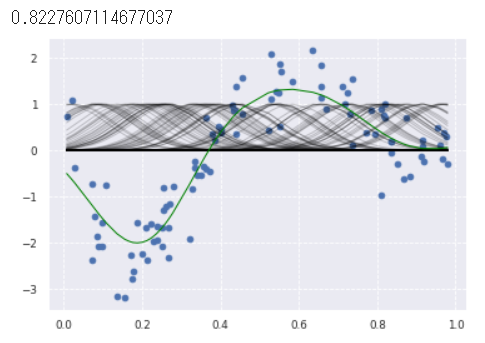
- Ridge回帰
- rbf_kernel()で生成したモデルをRidgeに渡している。組み合わせできるらしい。
from sklearn.metrics.pairwise import rbf_kernel
from sklearn.linear_model import Ridge

kx = rbf_kernel(X=data, Y=data, gamma=50)
clf = Ridge(alpha=30)
clf.fit(kx, target)

p_ridge = clf.predict(kx)

plt.scatter(data, target,label='data')
for i in range(len(kx)):
    plt.plot(data, kx[i], color='black', linestyle='-', linewidth=1, markersize=3, label='rbf', alpha=0.2)
plt.plot(data, p_ridge, color='green', linestyle='-', linewidth=1, markersize=3,label='ridge regression')

print(clf.score(kx, target))
- 多項式回帰
- $\boldsymbol{\hat{y}} = \sum_{n=0}^{N-1} \boldsymbol{w}_n \boldsymbol{x}^n $ について、n=1から10までずらしてそれぞれプロットする
- 4次以降はほとんど変化がないことを確認
# PolynomialFeatures(degree=1)
from sklearn.preprocessing import PolynomialFeatures
from sklearn.pipeline import Pipeline

plt.figure(figsize=(12,6))

deg = [1,2,3,4,5,6,7,8,9,10]
for d in deg:
    regr = Pipeline([
        ('poly', PolynomialFeatures(degree=d)),
        ('linear', LinearRegression())
    ])
    regr.fit(data, target)
    # make predictions
    p_poly = regr.predict(data)
    # plot regression result
    plt.scatter(data, target, label='data')
    plt.plot(data, p_poly, label='polynomial of degree %d' % (d))
plt.legend(loc="lower right")
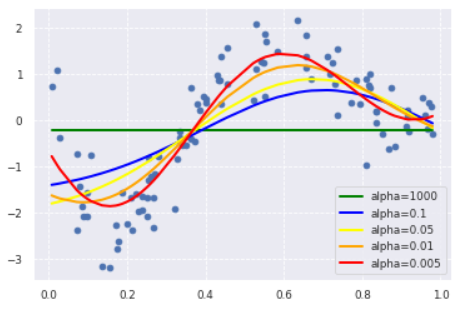
- Lasso回帰
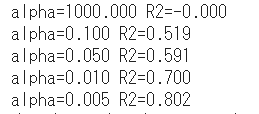
- 初期コードの罰則項のパラメータalphaが1000と大きくまったくフィットしていない
- alphaを変化させたときにフィット具合がどのように変化するかチェック
- alpha=0.1から徐々にフィットしていく
from sklearn.metrics.pairwise import rbf_kernel
from sklearn.linear_model import Lasso

kx = rbf_kernel(X=data, Y=data, gamma=5)
# ベースの散布図をプロット
plt.scatter(data, target)

# alphaを変動させてフィット具合が変化するかチェック
tmp_alpha = [1000, 0.1, 0.05, 0.01, 0.005]
tmp_color = ['green','blue','yellow','orange','red']
for idx, alpha in enumerate(tmp_alpha):
  lasso_clf = Lasso(alpha=alpha, max_iter=1000)
  lasso_clf.fit(kx, target)
  p_lasso = lasso_clf.predict(kx)
  plt.plot(data, p_lasso, color=tmp_color[idx], linestyle='-', linewidth=2, markersize=2, label='alpha=%s' % (alpha))

  # 決定係数
  print("alpha=%.3f R2=%.3f" % (alpha, lasso_clf.score(kx, target)))
plt.legend()
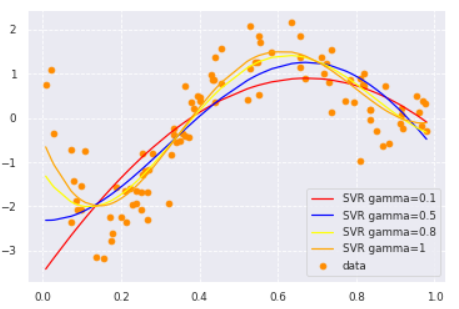
- サポートベクター回帰(Support Vector Regression)
- サポートベクターマシンの回帰バージョン。
- gamma=0.1から少しずつ増加させるとフィット度合いが変化した
from sklearn import model_selection, preprocessing, linear_model, svm

plt.scatter(data, target, color='darkorange', label='data')
# gammaを変動させてフィット具合が変化するかチェック
tmp_gamma = [0.1, 0.5, 0.8, 1]
tmp_color = ['red','blue','yellow','orange']

for idx, gamma in enumerate(tmp_gamma):
  clf_svr = svm.SVR(kernel='rbf', C=1e3, gamma=gamma, epsilon=0.1)
  clf_svr.fit(data, target)
  y_rbf = clf_svr.fit(data, target).predict(data)

  # plot
  plt.plot(data, y_rbf, color=tmp_color[idx], label='SVR gamma=%s' % (gamma))
plt.legend()
- DeepLearningによる回帰
- 中間層:8個、損失関数:MSE、オプティマイザ:adamで回帰
from sklearn.model_selection import train_test_split
x_train, x_test, y_train, y_test = train_test_split(data, target, test_size=0.1, random_state=0)
def relu_reg_model():
    model = Sequential()
    model.add(Dense(10, input_dim=1, activation='relu'))
    model.add(Dense(1000, activation='relu'))
    model.add(Dense(1000, activation='relu'))
    model.add(Dense(1000, activation='relu'))
    model.add(Dense(1000, activation='relu'))
    model.add(Dense(1000, activation='relu'))
    model.add(Dense(1000, activation='relu'))
    model.add(Dense(1000, activation='relu'))
    model.add(Dense(1000, activation='linear'))
    model.add(Dense(1))

    model.compile(loss='mean_squared_error', optimizer='adam')
    return model
from keras.models import Sequential
from keras.layers import Input, Dense, Dropout, BatchNormalization
from keras.wrappers.scikit_learn import KerasRegressor

# use data split and fit to run the model
estimator = KerasRegressor(build_fn=relu_reg_model, epochs=100, batch_size=5, verbose=1)

history = estimator.fit(x_train, y_train, callbacks=[cb_cp, cb_tf], validation_data=(x_test, y_test))
# 予測
y_pred = estimator.predict(x_train)
# plot
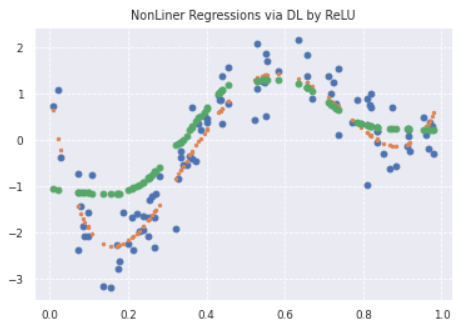
plt.title('NonLiner Regressions via DL by ReLU')
plt.plot(data, target, 'o')
plt.plot(data, true_func(data), '.')
plt.plot(x_train, y_pred, "o", label='predicted: deep learning')
3. ロジスティック回帰
3-1. 要点まとめ
- 適用領域
- 分類問題
- ある入力(数値)からクラスに分類する問題
- 扱うデータ
- 入力 説明変数
- 出力 目的変数 $y \in \{ 0, 1 \}$
- 例)タイタニックデータ、IRISデータなど
- 分類問題に対するアプローチ
- 識別的アプローチ ・・・ ロジスティック回帰
- $P(C_k|\boldsymbol{x}) $ を直接モデル化
- 生成的アプローチ
- $P(C_k)とP(\boldsymbol{x}|C_k) $をモデル化し、その後、ベイズの定理を用いて $P(C_k|\boldsymbol{x}) $ を求める
- $P(C_k|\boldsymbol{x}) = \frac{P(C_k,\boldsymbol{x})}{P(\boldsymbol{x})} = \frac{P(\boldsymbol{x}|C_k) P(C_k)}{P(\boldsymbol{x})} $
- $P(C_k)とP(\boldsymbol{x}|C_k) $をモデル化し、その後、ベイズの定理を用いて $P(C_k|\boldsymbol{x}) $ を求める
- 識別関数 ・・・ SVMなど
- $\left\{ \begin{array}{ll} f(x) \ge 0 \cdots C=1 \\ f(x) \lt 0 \cdots C=0 \end{array} \right. $
- クラス$C_k$に割り当てられる確率は出せない
- 識別的アプローチ ・・・ ロジスティック回帰
- 分類問題
- sigmoid関数
- sigmoid関数を経由することで、実数全体から[0,1]へつぶす
- sigmoid関数の微分
- $\sigma(z) = \frac{1}{1+\exp(-z)} = \left\{ 1 + exp(-z) \right\}^{-1} $
- ⇒ $\frac{d\sigma(z)}{d(z)} = -1 \left\{ 1 + exp(-z) \right\}^{-2} \exp(-z) (-1) \\ \because \frac{d}{dx} f(g(x)) = f^{'}(g(x)) g^{'}(x) $
- ⇒ $\frac{1}{1+\exp{-z}} \frac{\exp(-z)}{1+\exp{-z}} $
- ⇒ $\sigma(z) (1 - \sigma(z))$
- ※sigmoid関数の微分はsigmoid関数で表せる
- ロジスティック回帰モデルの説明
- データの線形結合を計算
- シグモイド関数に入力すると、確率が出力される
- $P(Y=1|X) = \sigma(w_0 + w_1 x_1 + \cdots + w_m x_m) $
- 確率分布として、ベルヌーイ分布を利用する。
- パラメータの推定
- ベルヌーイ分布をもとにデータからパラメータ(確率p)を推定する
- 尤度関数とは
- データを固定し、パラメータを変化させる
- 尤度関数を最大化するようなパラメータを選ぶ推定方法を最尤推定という
- ロジスティック回帰モデルの最尤推定
- 対数関数は単調増加(対数尤度関数が最大になる点と尤度関数が最大になる点は同じ)
- 対数を取る理由 ⇒ 確率の掛け算は極端に小さな値になることを防ぐ
- $E(w_0,w_1,\cdots,w_m) \\ = - \log L (w_0 , w_1,\cdots,w_m) \\ = - \sum_{i=1}^n \left\{ y_i \log p_i + (1-y_i) \log(1-p_i) \right\}$
- 課題
- sigmoid関数が原因で解析解をきれいに求めることができない
- 勾配下降法
- 反復学習によりパラメータを逐次的に更新するアプローチの一つ
- $\eta$は学習率と呼ばれるハイパーパラメータ
- 対数尤度関数をパラメータで微分して0になる値を求める必要があるが、解析的に求めることは難しい
- $\boldsymbol{w}^{(k+1)} = \boldsymbol{w}^{(k)} - \eta \frac{\partial E (\boldsymbol{w})}{\partial \boldsymbol{w}}$
- 対数尤度関数を係数とバイアスに関して微分
- $p_i = \sigma(\boldsymbol{w}^T \boldsymbol{x}_i) = \frac{1}{1 + \exp(\boldsymbol{w}^T \boldsymbol{x}_i)} $
- $\mbox{Loss:} E (\boldsymbol{w}) = - \log L(\boldsymbol{w}) \\ = - \sum_{i=1}^n \left\{y_i \log p_i + (1 - y_i) \log (1 - p_i) \right\}$
- $\frac{\partial E (\boldsymbol{w})}{\partial \boldsymbol{w}} = - \sum_{i=1}^n \left\{y_i \log p_i + (1 - y_i) \log (1 - p_i) \right\} \\ = - \sum_{i=1}^n \frac{\partial E_i}{\partial p_i} \frac{\partial p_i}{\partial z_i} \frac{\partial z_i}{\partial \boldsymbol{w}} \\ = - \sum_{i=1}^n \left( \frac{y_i}{p_i} - \frac{1-y_i}{1-p_i} \right) p_i (1-p_i) \boldsymbol{x_i} \\ = - \sum_{i=1}^n \left\{ y_i(1-p_i) - (1-y_i)p_i \right\} \boldsymbol{x_i} \\ = - \sum_{i=1}^n \left\{ y_i - p_i \right\} \boldsymbol{x_i} $
- 確率的勾配下降法(SGD)
- データを一つずつランダムに選んでパラメータを更新
- 効率よく最適な解を探索可能
- モデルの評価
- 混同行列
- 各検証データに対するモデルの予測結果を4つの観点で分類。
- 混同行列
3-2. 演習
- データの読み込み(タイタニックデータ)
# titanic data csvファイルの読み込み
titanic_df = pd.read_csv('data/titanic_train.csv')
# 予測に不要と考えるからうをドロップ (本当はここの情報もしっかり使うべきだと思っています)
titanic_df.drop(['PassengerId', 'Name', 'Ticket', 'Cabin'], axis=1, inplace=True)
- 欠損値に対する対処
# 欠損値の確認
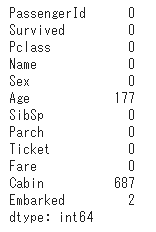
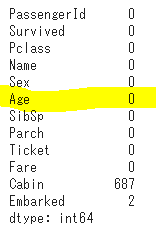
titanic_df.isnull().sum()
# Ageカラムのnullを中央値で補完
titanic_df['Age'] = titanic_df['Age'].fillna(titanic_df['Age'].mean())
- 実装(チケット価格から生死を判別)
# 運賃だけのリストを作成
data1 = titanic_df.loc[:, ["Fare"]].values
# 生死フラグのみのリストを作成
label1 =  titanic_df.loc[:,["Survived"]].values
# 学習
from sklearn.linear_model import LogisticRegression
model=LogisticRegression()
model.fit(data1, label1)
- サンプリングで予測してみる
- 運賃=62を境界(生存側の確率>=0.5)に判定が変わっていることが確認
# 運賃を入力すると生存可否と生存確率を戻す
def was_survived(fare):
  ret_survived = model.predict([[fare]])
  rate = model.predict_proba([[fare]])
  print('生存可否:%d、生存確率:%.3f' % (ret_survived, rate[0,1]))

was_survived(61)
was_survived(62)
was_survived(63)
- 実装(2変数から生死を判別)
# 性別を区分化
titanic_df['Gender'] = titanic_df['Sex'].map({'female': 0, 'male': 1}).astype(int)
# PclassとGenderを加味した別の特徴量を作成
titanic_df['Pclass_Gender'] = titanic_df['Pclass'] + titanic_df['Gender']
# 説明変数
data2 = titanic_df.loc[:, ["AgeFill", "Pclass_Gender"]].values
# 目的変数
label2 =  titanic_df.loc[:,["Survived"]].values
# 学習
model2 = LogisticRegression()
model2.fit(data2, label2)
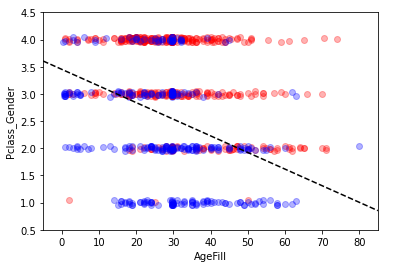
- 生死の境界線をプロット
h = 0.02
xmin, xmax = -5, 85
ymin, ymax = 0.5, 4.5
xx, yy = np.meshgrid(np.arange(xmin, xmax, h), np.arange(ymin, ymax, h))
Z = model2.predict_proba(np.c_[xx.ravel(), yy.ravel()])[:, 1]
Z = Z.reshape(xx.shape)

fig, ax = plt.subplots()
levels = np.linspace(0, 1.0)
cm = plt.cm.RdBu
cm_bright = ListedColormap(['#FF0000', '#0000FF'])
# contour = ax.contourf(xx, yy, Z, cmap=cm, levels=levels, alpha=0.5)

sc = ax.scatter(titanic_df.loc[index_survived, 'AgeFill'],
                titanic_df.loc[index_survived, 'Pclass_Gender']+(np.random.rand(len(index_survived))-0.5)*0.1,
                color='r', label='Not Survived', alpha=0.3)
sc = ax.scatter(titanic_df.loc[index_notsurvived, 'AgeFill'],
                titanic_df.loc[index_notsurvived, 'Pclass_Gender']+(np.random.rand(len(index_notsurvived))-0.5)*0.1,
                color='b', label='Survived', alpha=0.3)

ax.set_xlabel('AgeFill')
ax.set_ylabel('Pclass_Gender')
ax.set_xlim(xmin, xmax)
ax.set_ylim(ymin, ymax)
# fig.colorbar(contour)

x1 = xmin
x2 = xmax
y1 = -1*(model2.intercept_[0]+model2.coef_[0][0]*xmin)/model2.coef_[0][1]
y2 = -1*(model2.intercept_[0]+model2.coef_[0][0]*xmax)/model2.coef_[0][1]
ax.plot([x1, x2] ,[y1, y2], 'k--')
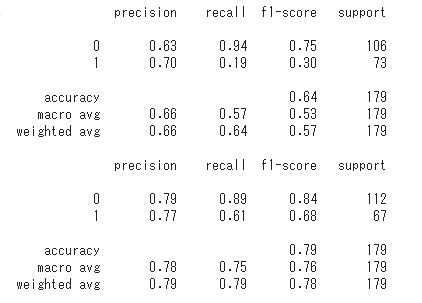
- モデル評価
### 途中略 ###
from sklearn import metrics
print(metrics.classification_report(testlabel1, predictor_eval1))
print(metrics.classification_report(testlabel2, predictor_eval2))
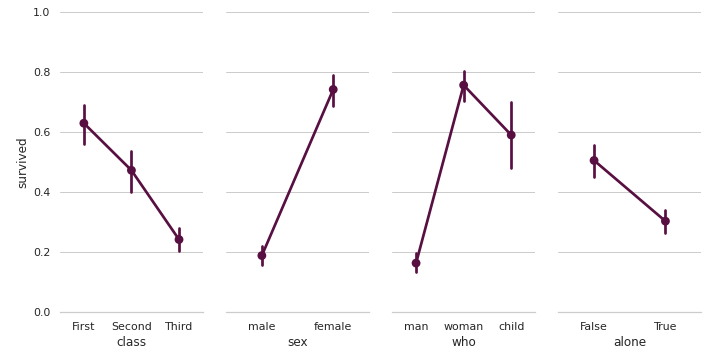
- seaborn Paired categorical plots
- Rのggplotにおけるfacet_wrapみたいなものか
# Paired categorical plots

import seaborn as sns
sns.set(style="whitegrid")

# Load the example Titanic dataset
titanic = sns.load_dataset("titanic")

# Set up a grid to plot survival probability against several variables
g = sns.PairGrid(titanic, y_vars="survived",
                 x_vars=["class", "sex", "who", "alone"],
                 size=5, aspect=.5)

# Draw a seaborn pointplot onto each Axes
g.map(sns.pointplot, color=sns.xkcd_rgb["plum"])
g.set(ylim=(0, 1))
sns.despine(fig=g.fig, left=True)
plt.show()
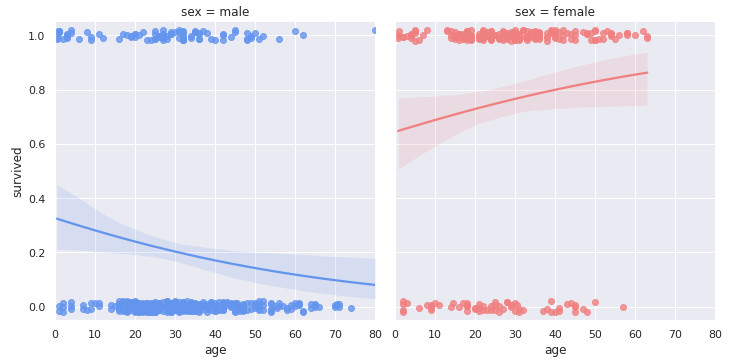
- seaborn lmplot
- logistic=Trueでロジスティック回帰結果を可視化できる模様
# Faceted logistic regression

import seaborn as sns
sns.set(style="darkgrid")

# Load the example titanic dataset
df = sns.load_dataset("titanic")

# Make a custom palette with gendered colors
pal = dict(male="#6495ED", female="#F08080")

# Show the survival proability as a function of age and sex
g = sns.lmplot(x="age", y="survived", col="sex", hue="sex", data=df,
               palette=pal, y_jitter=.02, logistic=True)
g.set(xlim=(0, 80), ylim=(-.05, 1.05))
plt.show()
4. 主成分分析
4-1. 要点まとめ
- 主成分分析とは
- 多変量データをより少数個の指標に圧縮
- 情報の損失をなるべく小さくしつつ少数個の変数に圧縮
- 可視化がしやすくなる
- 係数ベクトルが変われば線形変換後の値が変化
- 情報の量を分散の大きさと捉える
- 線形変換後の変数の分散が最大となる射影軸を探索
- 多変量データをより少数個の指標に圧縮
- 数式
- 線形変換後の分散
- $Var(\boldsymbol{s_j}) = \frac{1}{n} s_j^T s_j = \frac{1}{n}(\bar{X} \boldsymbol{a}_j)^T (\bar{X} \boldsymbol{a}_j) = \frac{1}{n}( \boldsymbol{a}_j^T \bar{X}^T \bar{X} \boldsymbol{a}_j) = a_j^T Var (\bar{X}) \boldsymbol{a}_j $
- 制約付き最適化問題を解く
- ノルムが1となる制約を入れる(制約を入れないと無限に解がある)
- ラグランジュ関数を最大にする係数ベクトルを探索(微分して0になる点)
- $E(\boldsymbol{a_j}) = \boldsymbol{a_j}^T Var(\bar{X}) \boldsymbol{a_j} - \lambda(\boldsymbol{a_j}^T \boldsymbol{a_j} - 1)$
- 射影先の分散は固有値と一致
- 線形変換後の分散
- 寄与率
- 寄与率:第k主成分の分散の全分散に対する割合(第k主成分が持つ情報量の割合)
- 累積寄与率:第1-k主成分まで圧縮した際の情報損失量の割合
4-2. 演習
- ライブラリインポート
import pandas as pd
from sklearn.model_selection import train_test_split
from sklearn.preprocessing import StandardScaler
from sklearn.linear_model import LogisticRegressionCV
from sklearn.metrics import confusion_matrix
from sklearn.decomposition import PCA
import matplotlib.pyplot as plt
%matplotlib inline
- shape確認
print('cancer df shape: {}'.format(cancer_df.shape))
# cancer df shape: (569, 32)
- diagnosis: 診断結果 (良性がB / 悪性がM) ・説明変数は3列以降、目的変数を2列目としロジスティック回帰で分類
- 検証スコア97%で分類できることを確認
# 目的変数
y = cancer_df.diagnosis.apply(lambda d: 1 if d == 'M' else 0)
# 説明変数
X = cancer_df.loc[:, 'radius_mean':]
# 学習用とテスト用でデータを分離
X_train, X_test, y_train, y_test = train_test_split(X, y, random_state=0)

# 標準化
scaler = StandardScaler()
X_train_scaled = scaler.fit_transform(X_train)
X_test_scaled = scaler.transform(X_test)

# ロジスティック回帰で学習
logistic = LogisticRegressionCV(cv=10, random_state=0)
logistic.fit(X_train_scaled, y_train)

# 検証
print('Train score: {:.3f}'.format(logistic.score(X_train_scaled, y_train)))
print('Test score: {:.3f}'.format(logistic.score(X_test_scaled, y_test)))
print('Confustion matrix:\n{}'.format(confusion_matrix(y_true=y_test, y_pred=logistic.predict(X_test_scaled))))
# Train score: 0.988
# Test score: 0.972
# Confustion matrix:
# [[89  1]
# [ 3 50]]
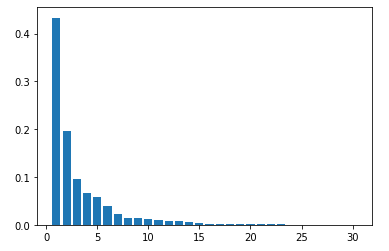
- PCAによる次元削減(次元数30まで)
- 各主成分毎の寄与率をプロット
- 第3主成分までで70%を超えているように見える(目視)
pca = PCA(n_components=30)
pca.fit(X_train_scaled)
plt.bar([n for n in range(1, len(pca.explained_variance_ratio_)+1)], pca.explained_variance_ratio_)
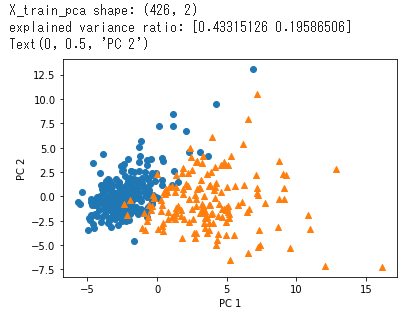
- PCAによる次元削減(次元数2まで)して散布図にプロット
- 良性(〇)と悪性(△)がきれいに分かれていることを確認
# PCA
# 次元数2まで圧縮
pca = PCA(n_components=2)
X_train_pca = pca.fit_transform(X_train_scaled)
print('X_train_pca shape: {}'.format(X_train_pca.shape))
# X_train_pca shape: (426, 2)

# 寄与率
print('explained variance ratio: {}'.format(pca.explained_variance_ratio_))
# explained variance ratio: [ 0.43315126  0.19586506]

# 散布図にプロット
temp = pd.DataFrame(X_train_pca)
temp['Outcome'] = y_train.values
b = temp[temp['Outcome'] == 0]
m = temp[temp['Outcome'] == 1]
plt.scatter(x=b[0], y=b[1], marker='o') # 良性は○でマーク
plt.scatter(x=m[0], y=m[1], marker='^') # 悪性は△でマーク
plt.xlabel('PC 1') # 第1主成分をx軸
plt.ylabel('PC 2') # 第2主成分をy軸
5. k近傍法、k-means
5-1. 要点まとめ
- k近傍法
- 教師なし学習
- 分類問題のための機械学習手法
- 最近傍のデータをk個とってきて、それらが最も多く所属するクラスに識別
- kにより結果が変わる。k=1の場合を最近傍法と呼ぶ。
- kをどのように選ぶかが課題。
- k-means
- 教師なし学習
- クラスタリング手法
- 与えられたデータをk個のクラスタに分類する
- k-means法のアルゴリズム
-
- 各クラスタの中心の初期値を設定する
-
- 各データ点に対して、各クラスタ中心との距離を計算し、最も距離が近いクラスタを割り当てる
-
- 各クラスタの平均ベクトル(中心)を計算する
-
- 終息するまで2), 3)の処理を繰り返す
-
- 初期値が近いとうまくクラスタリングできない。
- k-means++により初期値をうまく決めることができる
- kをどのように選ぶかが課題。
- kエルボー法、シルエットプロットなどがある
5-2. 演習
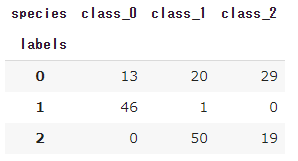
- kmeansによるクラスタリング(ワインデータ)
import numpy as np
import pandas as pd
import matplotlib.pyplot as plt
from sklearn import cluster, preprocessing, datasets
from sklearn.cluster import KMeans
# ワインのデータセット
wine = datasets.load_wine()
# 特徴量
X = wine.data
# ターゲット
y=wine.target
# k=3でクラスタリング
model = KMeans(n_clusters=3)
labels = model.fit_predict(X)
df = pd.DataFrame({'labels': labels})
def species_label(theta):
    if theta == 0:
        return wine.target_names[0]
    if theta == 1:
        return wine.target_names[1]
    if theta == 2:
        return wine.target_names[2]

df['species'] = [species_label(theta) for theta in wine.target]
pd.crosstab(df['labels'], df['species'])
- K近傍法による分類
# ライブラリ
from sklearn.neighbors import KNeighborsClassifier
from sklearn.model_selection import train_test_split
# train用とtest用のデータ用意。test_sizeでテスト用データの割合を指定。random_stateはseed値を適当にセット。
X_tr, X_te, y_tr, y_te = train_test_split(X, y, test_size = 0.2, random_state=123)
print('[train] X:%s y:%s' %(X_tr.shape, y_tr.shape))
print('[test] X:%s y:%s' %(X_te.shape, y_te.shape))
# [train] X:(142, 13) y:(142,)
# [test] X:(36, 13) y:(36,)
# インスタンス生成。n_neighbors:Kの数
knn = KNeighborsClassifier(n_neighbors=3)
knn.fit(X_tr, y_tr)
# 予測
y_tr_pred = knn.predict(X_tr)
y_te_pred = knn.predict(X_te)

# 精度確認用のライブラリインポートと実行
from sklearn import metrics
print('[train] accuracy:%.3f' % (metrics.accuracy_score(y_tr, y_tr_pred)))
print('[test] accuracy:%.3f' % (metrics.accuracy_score(y_te, y_te_pred)))
# [train] accuracy:0.887
# [test] accuracy:0.611
6. サポートベクターマシン
6-1. 要点まとめ
- 概要
- 2クラス分類のための機械学習手法
- 線形モデルの正負で2値分類
- マージン
- 線形判別関数ともっとも近いデータ点との距離をマージンという
- マージンが最大となる線形判別関数を求める
- サポートベクター
- データを分割する直線に最も近いデータ点
- 分離超平面を構成する学習データは、サポートベクターだけで残りのデータは不要
- ソフトマージンSVM
- サンプルを線形分離できないとき
- 誤差を許容し、誤差に対してペナルティを与える
- パラメータCの大小で決定境界が変化
- Cが小さい時 ⇒ 誤差をより許容する
- Cが大きい時 ⇒ 誤差をあまり許容しない
- 非線形分離
- 線形分離できないとき
- 特徴空間に写像し、その空間で線形に分類する
6-2. 演習
-
- 線形分離可能なケース
%matplotlib inline
import numpy as np
import matplotlib.pyplot as plt
def gen_data():
    x0 = np.random.normal(size=50).reshape(-1, 2) - 2.
    x1 = np.random.normal(size=50).reshape(-1, 2) + 2.
    X_train = np.concatenate([x0, x1])
    ys_train = np.concatenate([np.zeros(25), np.ones(25)]).astype(np.int)
    return X_train, ys_train
X_train, ys_train = gen_data()
plt.scatter(X_train[:, 0], X_train[:, 1], c=ys_train)
- 学習
index = a > 1e-6
support_vectors = X_train[index]
support_vector_t = t[index]
support_vector_a = a[index]

term2 = K[index][:, index].dot(support_vector_a * support_vector_t)
b = (support_vector_t - term2).mean()
- 予測
index = a > 1e-6
support_vectors = X_train[index]
support_vector_t = t[index]
support_vector_a = a[index]

term2 = K[index][:, index].dot(support_vector_a * support_vector_t)
b = (support_vector_t - term2).mean()
xx0, xx1 = np.meshgrid(np.linspace(-5, 5, 100), np.linspace(-5, 5, 100))
xx = np.array([xx0, xx1]).reshape(2, -1).T

X_test = xx
y_project = np.ones(len(X_test)) * b
for i in range(len(X_test)):
    for a, sv_t, sv in zip(support_vector_a, support_vector_t, support_vectors):
        y_project[i] += a * sv_t * sv.dot(X_test[i])
y_pred = np.sign(y_project)
# 訓練データを可視化
plt.scatter(X_train[:, 0], X_train[:, 1], c=ys_train)
# サポートベクトルを可視化
plt.scatter(support_vectors[:, 0], support_vectors[:, 1],
                    s=100, facecolors='none', edgecolors='k')
# 領域を可視化
# plt.contourf(xx0, xx1, y_pred.reshape(100, 100), alpha=0.2, levels=np.linspace(0, 1, 3))
# マージンと決定境界を可視化
plt.contour(xx0, xx1, y_project.reshape(100, 100), colors='k',
                     levels=[-1, 0, 1], alpha=0.5, linestyles=['--', '-', '--'])
# マージンと決定境界を可視化
plt.quiver(0, 0, 0.1, 0.35, width=0.01, scale=1, color='pink')
-
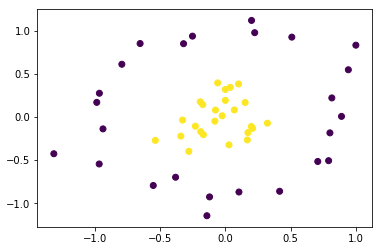
- 線形分離不可能な場合
factor = .2
n_samples = 50
linspace = np.linspace(0, 2 * np.pi, n_samples // 2 + 1)[:-1]
outer_circ_x = np.cos(linspace)
outer_circ_y = np.sin(linspace)
inner_circ_x = outer_circ_x * factor
inner_circ_y = outer_circ_y * factor

X = np.vstack((np.append(outer_circ_x, inner_circ_x),
               np.append(outer_circ_y, inner_circ_y))).T
y = np.hstack([np.zeros(n_samples // 2, dtype=np.intp),
               np.ones(n_samples // 2, dtype=np.intp)])
X += np.random.normal(scale=0.15, size=X.shape)
x_train = X
y_train = y
plt.scatter(x_train[:,0], x_train[:,1], c=y_train)
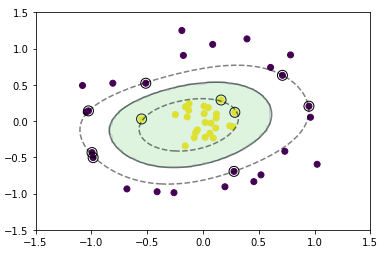
- RBFカーネル(ガウシアンカーネル)を利用
def rbf(u, v):
        sigma = 0.8
        return np.exp(-0.5 * ((u - v)**2).sum() / sigma**2)

X_train = x_train
t = np.where(y_train == 1.0, 1.0, -1.0)

n_samples = len(X_train)
# RBFカーネル
K = np.zeros((n_samples, n_samples))
for i in range(n_samples):
    for j in range(n_samples):
        K[i, j] = rbf(X_train[i], X_train[j])

eta1 = 0.01
eta2 = 0.001
n_iter = 5000

H = np.outer(t, t) * K

a = np.ones(n_samples)
for _ in range(n_iter):
    grad = 1 - H.dot(a)
    a += eta1 * grad
    a -= eta2 * a.dot(t) * t
    a = np.where(a > 0, a, 0)
- 予測
index = a > 1e-6
support_vectors = X_train[index]
support_vector_t = t[index]
support_vector_a = a[index]

term2 = K[index][:, index].dot(support_vector_a * support_vector_t)
b = (support_vector_t - term2).mean()
xx0, xx1 = np.meshgrid(np.linspace(-1.5, 1.5, 100), np.linspace(-1.5, 1.5, 100))
xx = np.array([xx0, xx1]).reshape(2, -1).T

X_test = xx
y_project = np.ones(len(X_test)) * b
for i in range(len(X_test)):
    for a, sv_t, sv in zip(support_vector_a, support_vector_t, support_vectors):
        y_project[i] += a * sv_t * rbf(X_test[i], sv)
y_pred = np.sign(y_project)
# 訓練データを可視化
plt.scatter(x_train[:, 0], x_train[:, 1], c=y_train)
# サポートベクトルを可視化
plt.scatter(support_vectors[:, 0], support_vectors[:, 1],
                    s=100, facecolors='none', edgecolors='k')
# 領域を可視化
plt.contourf(xx0, xx1, y_pred.reshape(100, 100), alpha=0.2, levels=np.linspace(0, 1, 3))
# マージンと決定境界を可視化
plt.contour(xx0, xx1, y_project.reshape(100, 100), colors='k',
                     levels=[-1, 0, 1], alpha=0.5, linestyles=['--', '-', '--'])
-
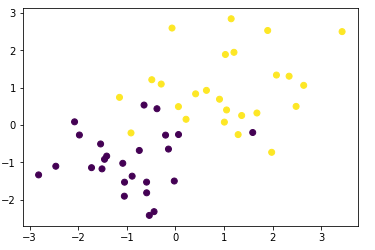
- 重なりありの場合
x0 = np.random.normal(size=50).reshape(-1, 2) - 1.
x1 = np.random.normal(size=50).reshape(-1, 2) + 1.
x_train = np.concatenate([x0, x1])
y_train = np.concatenate([np.zeros(25), np.ones(25)]).astype(np.int)
plt.scatter(x_train[:, 0], x_train[:, 1], c=y_train)
- 学習
X_train = x_train
t = np.where(y_train == 1.0, 1.0, -1.0)

n_samples = len(X_train)
# 線形カーネル
K = X_train.dot(X_train.T)

C = 1
eta1 = 0.01
eta2 = 0.001
n_iter = 1000

H = np.outer(t, t) * K

a = np.ones(n_samples)
for _ in range(n_iter):
    grad = 1 - H.dot(a)
    a += eta1 * grad
    a -= eta2 * a.dot(t) * t
    a = np.clip(a, 0, C)
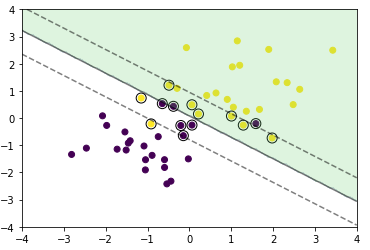
- 予測
index = a > 1e-8
support_vectors = X_train[index]
support_vector_t = t[index]
support_vector_a = a[index]

term2 = K[index][:, index].dot(support_vector_a * support_vector_t)
b = (support_vector_t - term2).mean()
xx0, xx1 = np.meshgrid(np.linspace(-4, 4, 100), np.linspace(-4, 4, 100))
xx = np.array([xx0, xx1]).reshape(2, -1).T

X_test = xx
y_project = np.ones(len(X_test)) * b
for i in range(len(X_test)):
    for a, sv_t, sv in zip(support_vector_a, support_vector_t, support_vectors):
        y_project[i] += a * sv_t * sv.dot(X_test[i])
y_pred = np.sign(y_project)
# 訓練データを可視化
plt.scatter(x_train[:, 0], x_train[:, 1], c=y_train)
# サポートベクトルを可視化
plt.scatter(support_vectors[:, 0], support_vectors[:, 1],
                    s=100, facecolors='none', edgecolors='k')
# 領域を可視化
plt.contourf(xx0, xx1, y_pred.reshape(100, 100), alpha=0.2, levels=np.linspace(0, 1, 3))
# マージンと決定境界を可視化
plt.contour(xx0, xx1, y_project.reshape(100, 100), colors='k',
                     levels=[-1, 0, 1], alpha=0.5, linestyles=['--', '-', '--'])
