概要
気象庁のHPで過去の台風発生数がまとめてあるcsvファイルを見つけたので
総数をグラフで表してみる。
hr.py
#!/usr/bin/env python
# -*- coding: utf-8 -*-

import csv
import math
import numpy as np
import sys, os
from matplotlib import pyplot

listage = []
listnum = []

with open('generation.csv', 'r',encoding='cp932') as f:
    reader = csv.reader(f)
    header = next(reader)  # ヘッダーを読み飛ばしたい時

    for row in reader:
        listage.append(row[0])
        listnum.append(row[13])
x = listage
y = listnum
pyplot.plot(x, y,)
pyplot.xticks([1960,1970,1980,1990,2000,2010], ["1960","1970","1980","1990","2000","2010"])
pyplot.xlabel("Year")
pyplot.show()
結果
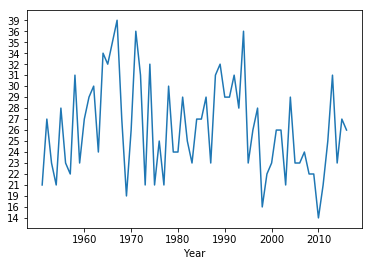
よく分からなかった