はじめに
古典的統計学において, 「信頼区間」という概念は主に推定(区間推定)と検定(仮説検定), 回帰分析の3つに登場する. 今回はこれらのうち「検定」を対象として, 母平均の差の検定と母比率の差の検定を確認する.
まず改めて統計的仮説検定とは, 母集団分布の母数に関する仮説を標本から検証する統計学的方法の1つである. Rではt.test()関数などを用いることで1行のコードで検定が実行できるものの中身がBlack Boxになりがちだ.
そこで今回は統計量tやp値をできるだけ手計算し, 帰無仮説の分布を可視化することでより直感的な理解を目指す.
母平均の差の検定
母平均の差の検定における検定統計量*(t or z)*は下記の通り, 検証条件によって求める式が変わる.
| 母平均の差の検定 | 標本の群数 | 標本の対応 | 母分散の等分散性 | t値 |
|---|---|---|---|---|
| One-Sample t test | 1群 | - | 等分散である | $t=\frac{\bar{X}-\mu}{\sqrt{\frac{s^2}{n}}}$ |
| Paired t test | 2群 | 対応あり | 等分散である | $t=\frac{\bar{X_D}-\mu}{\sqrt{\frac{s_D^2}{n}}}$ |
| Student's test | 2群 | 対応なし | 等分散である | $t=\frac{\bar{X_a}-\bar{X_b}}{\sqrt{s_{ab}^2}\sqrt{\frac{1}{n_a}+\frac{1}{n_b}}}$ |
| Welch test | 2群 | 対応なし | 等分散でない | $t=\frac{\bar{X_a}-\bar{X_b}}{\sqrt{\frac{s_a^2}{n_a}+\frac{s_b^2}{n_b}}}$ |
※本記事で式中に登場するsは, 母分散が既知の場合は標準偏差σ, 母分散が未知の場合は不偏標準偏差Uを指す
以降では, 代表的なものを例題を通して確認していく.
1標本のt検定(One-Sample t-test)
1標本のt検定は, ある意味区間推定とほぼ変わらない. p値もそうだが, 帰無仮説で差がないとする特定の数値(多くの場合は0)が, 設定した区間推定の上限下限に含まれているかを確認する.
今回は, 正規分布に従うwebページAの滞在時間の例を用いて, 帰無仮説を以下として片側検定する.
H_0: \mu\geq0\\
H_1: \mu<0\\
また, 1群のt検定におけるt統計量は, 以下で定義される.
t=\frac{\bar{X}-\mu}{\sqrt{\frac{s^2}{n}}}\\
まずは, t値をby handで計算する.
# データ生成
data<-rnorm(10,30,5)

# 帰無仮説よりμは0
mu<-0

# 平均値
x_hat<-mean(data)

# 不偏分散
uv<-var(data)

# サンプルサイズ
n<-length(data)

# 自由度
df<-n-1

# t値の推計
t<-(x_hat-mu)/(sqrt(uv/n))
t
- output: 36.397183465115
t.test()メソッドで, p値と$\bar{X}$の区間推定を確認する.
t.test(before, after, paired=TRUE, alternative="less", conf.level=0.95)
One Sample t-test
data: data
t = 36.397, df = 9, p-value = 4.418e-11
alternative hypothesis: true mean is not equal to 0
95 percent confidence interval:
28.08303 31.80520
sample estimates:
mean of x
29.94411
p値<0.05より, 帰無仮説を棄却する. よって母平均μ=0とは言えない結果となった.
対応のある2標本のt検定(Paired T-test)
「対応のある」とは, 同一サンプルから抽出された2群のデータに対する検定を指す. 対応のある2標本のt検定では, 基本的に2群の差が0かどうかを検定する. つまり, 前後差=0を帰無仮説とする1標本問題として検定する.
今回は, 正規分布に従うwebページAのデザイン変更前後の滞在時間の差の例を用いて, 帰無仮説を以下として片側検定する.
H_0: \bar{X_D}\geq\mu_D\\
H_1: \bar{X_D}<\mu_D\\
対応のある2標本の平均値の差の検定におけるt統計量は, 以下で定義される.
t=\frac{\bar{X_D}-\mu_D}{\sqrt{\frac{s_D^2}{n}}}\\
\bar{X_D}=\frac{1}{n}\sum_{i=1}^n (x_{Di})\\
s_D^2=\frac{1}{n}\sum_{i=1}^n (x_{Di}-\bar{x_D})^2\;\;or\;\;s_D^2=\frac{1}{n-1}\sum_{i=1}^n (x_{Di}-\bar{x_D})^2\\
まずは, t値をby handで計算する.
# データ生成
before<-c(32,45,43,65,76,54)
after<-c(42,55,73,85,56,64)

# 差分数列の生成
d<-before-after

# 帰無仮説よりμは0
mu<-0

# 差の平均
xd_hat<-mean(d)

# 差の標準偏差
sd<-var(d)

# サンプルサイズ
n<-length(d)

# 自由度
df<-n-1

# t値の推計
t=(xd_hat-mu)/sqrt(sd/n)
t
- output: -1.4638501094228
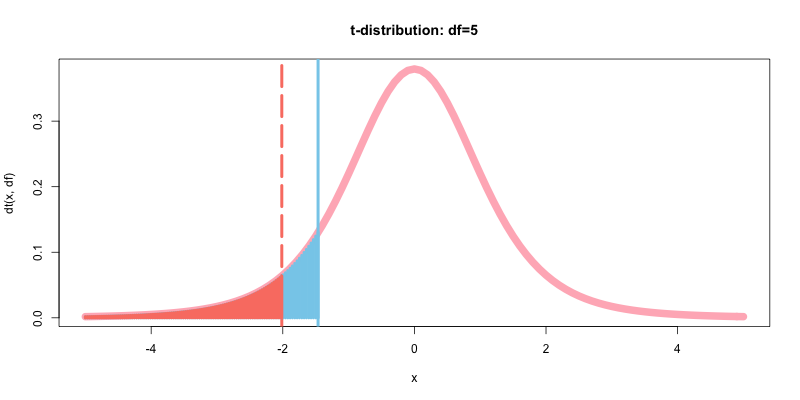
次に, p値を計算&可視化して有意水準α(棄却域)と比較する.
# 棄却域の定義
t_lower<-qt(0.05, df)

# 有意水準の出力
alpha<-pt(t_lower, df)
alpha

# p値
p<-pt(t,df)
p
- output: 0.05
- output: 0.101555331860027
# 棄却域の定義
t_lower<-qt(0.05, df)

options(repr.plot.width=14, repr.plot.height=8)
curve(dt(x, df),-5,5,type="l", col="lightpink", lwd=10, main="t-distribution: df=5")
abline(v=qt(p=0.05, df), col="salmon", lwd=4, lty=5)
abline(v=t, col="skyblue", lwd=4, lty=1)
curve(dt(x, df),-5,t,type="h", col="skyblue", lwd=4, add=T)
curve(dt(x, df),-5,qt(p=0.05,df),type="h", col="salmon", lwd=4, add=T)
p値>0.05であるようだ. t.test()メソッドで, t値とp値を確認する.
t.test(before, after, paired=TRUE, alternative="less", conf.level=0.95)
Paired t-test
data: before and after
t = -1.4639, df = 5, p-value = 0.1016
alternative hypothesis: true difference in means is less than 0
95 percent confidence interval:
-Inf 3.765401
sample estimates:
mean of the differences
-10
p値>0.05より, 帰無仮説を採択し, 母平均μは0とは言えない結果となった.
対応のないt検定(Unpaired T-test)
等分散性がある場合: Studentのt検定(Student's T-test)
対応のない2標本の平均値の差の検定において, 2標本の母分散が等しいということが既知の場合, スタンダードなStudentのt検定を用いる. その際, F検定による等分散に対する検定を行うことで判断する.
今回は, 正規分布に従うフランス人とイタリア人の平均身長の例を用いて, 帰無仮説を以下として片側検定する.
H_0: \bar{X_a}\geqq\bar{X_b}\\
H_1: \bar{X_a}<\bar{X_b}\\
等分散性がある2標本の平均値の差の検定におけるt統計量は, 以下で定義される.
t=\frac{\bar{X_a}-\bar{X_b}}{\sqrt{s_{ab}^2}\sqrt{\frac{1}{n_a}+\frac{1}{n_b}}}\\
s_{ab}^2=\frac{\sum_{i=1}^{n_a}(X_{ai}-\bar{X_a})^2+\sum_{i=1}^{n_b}(X_{bi}-\bar{X_b})^2}{n_a+n_b-2}\\
まずは, F検定により等分散性を確認する.
# Studentのt検定
# データ生成
france<-rnorm(8, 160, 4.5)
italy<-rnorm(10, 156, 5)

# 平均値
x_hat_france<-mean(france)
x_hat_italy<-mean(italy)

# 偏差平方和
vs_france<-sum((france-x_hat_france)^2)
vs_italy<-sum((italy-x_hat_italy)^2)

# サンプルサイズ
n_france<-length(france)
n_italy<-length(italy)

uv_france<-var(france)
uv_italy<-var(italy)

# 不偏分散同士の比率
f_value<-uv_france/uv_italy
f_value
# 等分散性の確認
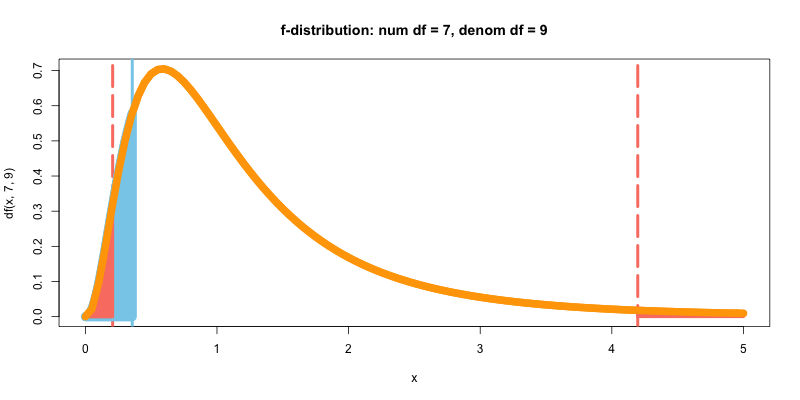
var.test(x=france, y=italy)
F test to compare two variances
data: france and italy
F = 0.37272, num df = 7, denom df = 9, p-value = 0.2068
alternative hypothesis: true ratio of variances is not equal to 1
95 percent confidence interval:
0.0888051 1.7977054
sample estimates:
ratio of variances
0.3727192
p値>0.05より, 帰無仮説を採択し, 等分散性があるとして進める. 次に, t値をby handで計算する.
# 自由度:
df<-n_france+n_italy-2

# t値の推計
student_t<-(x_hat_france-x_hat_italy)/sqrt(((vs_france+vs_italy)/(df))*(1/n_france+1/n_italy))
student_t
- output: 2.22021538587324
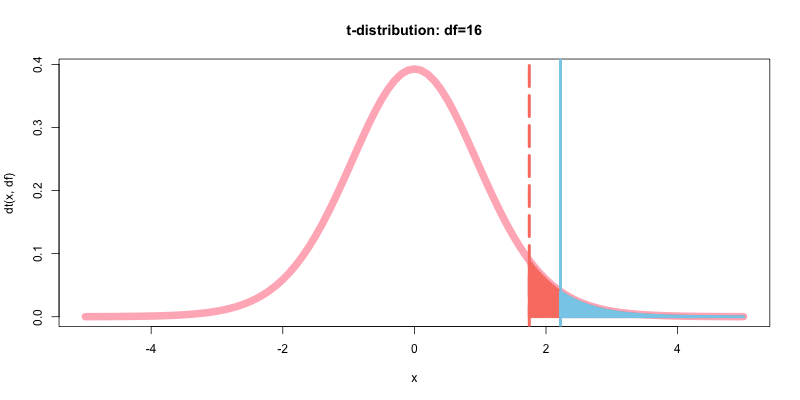
次に, p値を計算&可視化して有意水準α(棄却域)と比較する.
# 棄却域の定義
t_upper<-qt(0.95, df)

# 有意水準の出力
alpha<-1-pt(qt(0.95, df), df)
alpha

# p値
p<-1-pt(student_t, df)
p
- output: 0.05
- output: 0.020598429743329
# 棄却域の定義
t_upper<-qt(0.95, df)

options(repr.plot.width=14, repr.plot.height=8)
curve(dt(x, df),-5,5,type="l", col="lightpink", lwd=10, main="t-distribution: df=16")
abline(v=qt(p=0.95, df), col="salmon", lwd=4, lty=5)
abline(v=student_t, col="skyblue", lwd=4, lty=1)
curve(dt(x, df),qt(p=0.95,df),5,type="h", col="salmon", lwd=4, add=T)
curve(dt(x, df),student_t,5,type="h", col="skyblue", lwd=4, add=T)
p値<0.05であるようだ. t.test()メソッドで, t値とp値を確認する.
t.test(x=france, y=italy, var.equal=T, paired=F, alternative="greater", conf.level=0.95)
Two Sample t-test
data: france and italy
t = 2.2202, df = 16, p-value = 0.0206
alternative hypothesis: true difference in means is greater than 0
95 percent confidence interval:
0.6358715 Inf
sample estimates:
mean of x mean of y
160.6547 157.6784
p値<0.05より, 帰無仮説を棄却し, 2標本の母平均に差がありそうだという結果となった.
等分散性がない場合: Welchのt検定(Welch's T-test)
一方で, 2標本の母分散は等しいと言えない場合に使われるのがWelchののt検定である. ただし, 2段階検定の問題から2標本のt検定を行う場合には等分散性を問わず, Welch's T-testを行うべきだという主張もある.
今回は, 正規分布に従うフランス人とスペイン人の平均身長の例を用いて, 帰無仮説を以下として片側検定する.
H_0: \bar{X_a}\geqq\bar{X_b}\\
H_1: \bar{X_a}<\bar{X_b}\\
等分散性のない2標本の差の検定におけるt統計量は, 以下で定義される.
t=\frac{\bar{X_a}-\bar{X_b}}{\sqrt{\frac{s_a^2}{n_a}+\frac{s_b^2}{n_b}}}\\
まずは, F検定により等分散性を確認する.
# データ生成
france<-rnorm(8, 160, 3)
spain<-rnorm(11, 156, 7)

# 平均値
x_hat_france<-mean(france)
x_hat_spain<-mean(spain)

# 不偏分散
uv_france<-var(france)
uv_spain<-var(spain)

# サンプルサイズ
n_france<-length(france)
n_spain<-length(spain)

# 不偏分散同士の比率
f_value<-uv_france/uv_spain
f_value
# 等分散性の確認
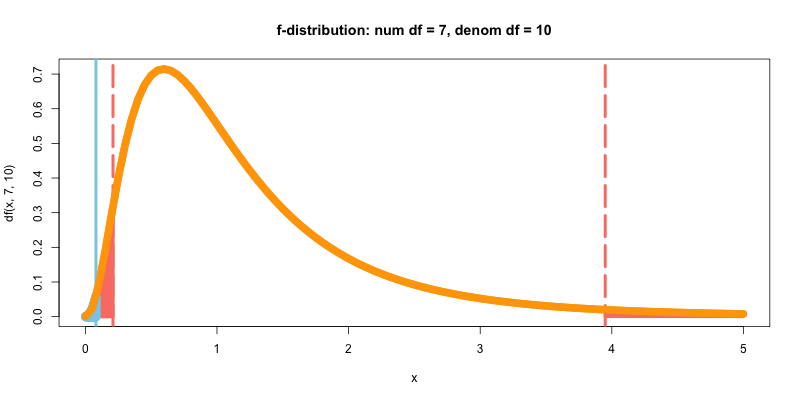
var.test(x=france, y=spain)
F test to compare two variances
data: france and spain
F = 0.068597, num df = 7, denom df = 10, p-value = 0.001791
alternative hypothesis: true ratio of variances is not equal to 1
95 percent confidence interval:
0.01736702 0.32659675
sample estimates:
ratio of variances
0.06859667
p値<0.05より, 帰無仮説を棄却し, 等分散性がないとして進める. 次に, t値をby handで計算する.
# 自由度: Welch–Satterthwaite equationで算出(省略)
df<-11.825

# t値の推計
welch_t<-(x_hat_france-x_hat_spain)/sqrt(uv_france/n_france+uv_spain/n_spain)
welch_t
- output: 0.9721899010868
次に, p値を計算&可視化して有意水準α(棄却域)と比較する.
# 棄却域の定義
t_upper<-qt(0.95, df)

# 有意水準の出力
alpha<-1-pt(qt(0.95, df), df)
alpha

# p値
p<-1-pt(welch_t, df)
p
- output: 0.05
- output: 0.175211697240612
# 棄却域の定義
t_lower<-qt(0.05, df)

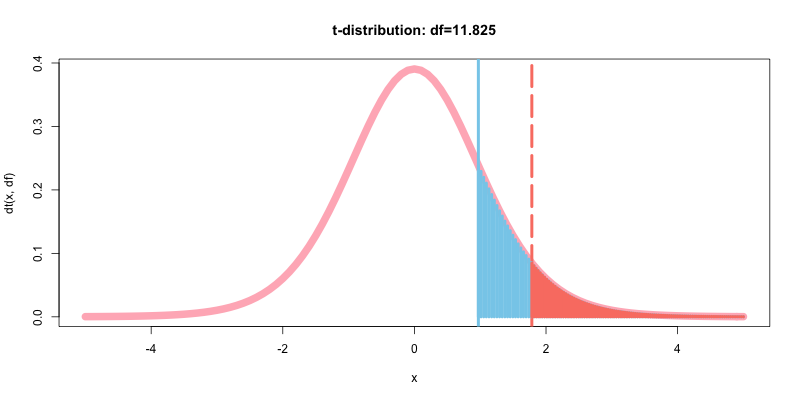
options(repr.plot.width=14, repr.plot.height=8)
curve(dt(x, df),-5,5,type="l", col="lightpink", lwd=10, main="t-distribution: df=5")
abline(v=qt(p=0.05, df), col="salmon", lwd=4, lty=5)
abline(v=t, col="skyblue", lwd=4, lty=1)
curve(dt(x, df),-5,t,type="h", col="skyblue", lwd=4, add=T)
curve(dt(x, df),-5,qt(p=0.05,df),type="h", col="salmon", lwd=4, add=T)
p値>0.05であるようだ. t.test()メソッドで, t値とp値を確認する.
t.test(x=france, y=spain, var.equal=F, paired=F, alternative="greater", conf.level=0.95)
Welch Two Sample t-test
data: france and spain
t = 0.97219, df = 11.825, p-value = 0.1752
alternative hypothesis: true difference in means is greater than 0
95 percent confidence interval:
-2.01141 Inf
sample estimates:
mean of x mean of y
158.7778 156.3704
p値>0.05より, 帰無仮説を採択し, 2標本の母平均には差があるとは言えなさそうだという結果となった.
母比率の差の検定
母比率の差の検定では, 2つのグループのある比率が等しいかどうかを検定する. またサンプルサイズnが十分に大きいとき, 二項分布が正規分布N(0, 1)に近似できることと同様に, 検定統計量にも標準正規分布に従う統計量zを用いる.
今回は, 正規分布に従うwebページAの滞在時間の例を用いて, 帰無仮説を以下として検定する.
H_0: \hat{p_a}=\hat{p_b}\\
H_1: \hat{p_a}\neq\hat{p_b}\\
また母比率の差の検定におけるt統計量は, 以下で定義される. なお帰無仮説が「2標本の母比率に差がない」という場合には, 分母に標本比率をプールした統合比率*(pooled proportion)*を用いることを注意したい.
z=\frac{\hat{p_a}-\hat{p_b}}{\sqrt{\hat{p}(1-\hat{p})\Bigl(\frac{1}{n_a}+\frac{1}{n_b}\Bigr)}}\\
\hat{p}=\frac{n_a\hat{p_a}+n_b\hat{p_b}}{n_a+n_b}
まずは, z値をby handで計算する.
# サンプル
new<-c(150, 10000)
old<-c(200, 12000)

# それぞれのpの期待値
p_hat_new<-new[1]/new[2]
p_hat_old<-old[1]/old[2]

# サンプルサイズ
n_new<-new[2]
n_old<-old[2]

# 統合比率
p_hat_pooled<-(n_new*p_hat_new+n_old*p_hat_old)/(n_new+n_old)

# z値の推計
z<-(p_hat_new-p_hat_old)/sqrt(p_hat_pooled*(1-p_hat_pooled)*(1/n_new+1/n_old))
z
- output: -0.983756784574025
次に, p値を計算&可視化して有意水準α(棄却域)と比較する.
# 棄却域の定義
z_lower<-qnorm(0.05, 0, 1)

# 有意水準の出力
alpha<-pnorm(qnorm(p=0.05, 0, 1), 0, 1)
alpha

# p値
p<-pnorm(z, 0, 1)
p
- output: 0.05
- output: 0.162617556154074
# 棄却域の定義
z_lower<-qnorm(0.05, 0, 1)

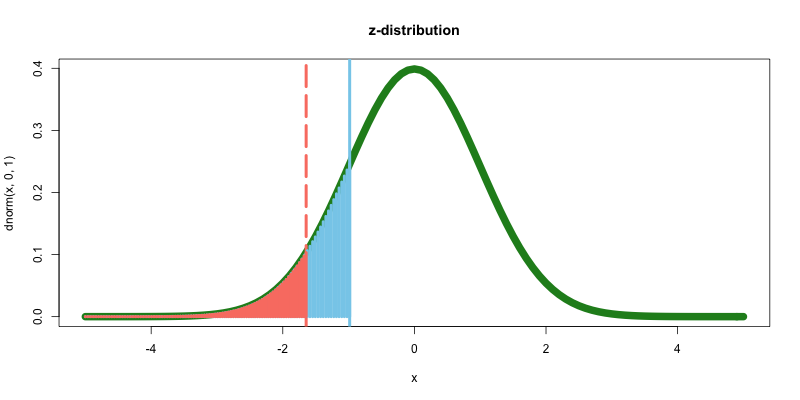
options(repr.plot.width=14, repr.plot.height=8)
curve(dnorm(x, 0, 1),-5,5,type="l", col="forestgreen", lwd=10, main="z-distribution")
abline(v=qnorm(p=0.05, 0, 1), col="salmon", lwd=4, lty=5)
abline(v=z, col="skyblue", lwd=4, lty=1)
curve(dnorm(x, 0, 1),-5,z,type="h", col="skyblue", lwd=4, add=T)
curve(dnorm(x, 0, 1),-5,qnorm(p=0.05,0, 1),type="h", col="salmon", lwd=4, add=T)
p値>0.05であるようだ. prop.test()メソッドで, t値とp値を確認する.
# correct: a logical indicating whether Yates’ continuity correction should be applied where possible.
prop.test(c(new[1],old[1]), c(new[2],old[2]), p=NULL, alternative="less", correct=F, conf.level=0.95)
2-sample test for equality of proportions without continuity
correction
data: c(new[1], old[1]) out of c(new[2], old[2])
X-squared = 0.96778, df = 1, p-value = 0.1626
alternative hypothesis: less
95 percent confidence interval:
-1.000000000 0.001106871
sample estimates:
prop 1 prop 2
0.01500000 0.01666667
p値>0.05より, 帰無仮説を採択し, 2標本の母比率に差はなさそうだという結果となった. また先ほど手計算したz値と上記のカイ二乗値が, またp値が一致していることが確認できる.
さいごに
以上で, 母平均・母比率の差の検定を終える. 今回は代表的な佐野検定だけを取り上げたが, 母分散が既知/未知などを気にすると無数に存在する. 次回はベイズ推定による差の検定をまとめる.
◎参考文献
- https://toukeigaku-jouhou.info/2018/07/07/hypothesis-testing-list/
- https://bellcurve.jp/statistics/course/18227.html
- http://www.ner.takushoku-u.ac.jp/masano/class_material/waseda/keiryo/6_t_test1.html
- https://biolab.sakura.ne.jp/z-test-proportion.html
- https://biolab.sakura.ne.jp/z-test-proportion.html
