自分用メモ
まず必要なこと
importとinline
test.py
import matplotlib.pyplot as plt
%matplotlib inline
import : ライブラリを使えるようにする
inline : グラフをjupyter上で使えるようにする
グラフのサイズ、フォントのサイズを指定したい
グラフのサイズを指定する
test.py
plt.figure(figsize = [10,10])
フォントのサイズを指定する
test.py
plt.rcParams["font.size"] = 18
グラフに表示する情報(凡例とか)
軸ラベル
test.py
plt.xlabel('hoge')
plt.ylabel('fuga')
凡例
① 引数にlabel(リスト系をいれる)を追加
test.py
labels = ['りんご', 'みかん', 'バナナ']
plt.bar(list_x,list_y, label = labels)
② plt.legend()を追加
test.py
plt.legend()
データに名前つける
引数にtick_label(リスト系を入れる)を追加。
test.py
labels = [
  'Canned Soft Drink'
  , 'Steak Burrito'
  , 'Chips and Guacamole'
  , 'Chicken Burrito'
  , 'Chicken Bowl'
]
plt.bar(list_x,list_y, tick_label = labels)

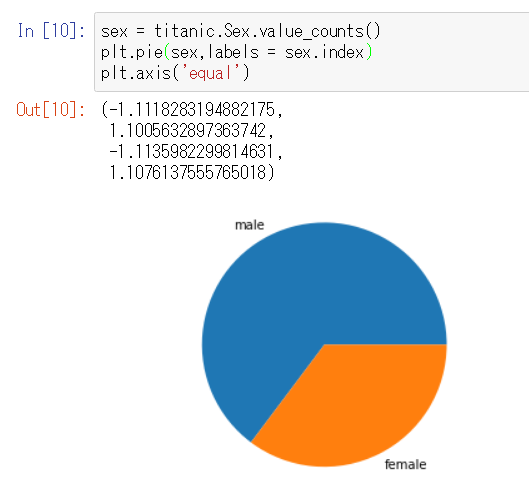
円グラフ(pie chart)
jupyter上で円が楕円になるとき
jupyter上でパイチャートを描くと楕円になる
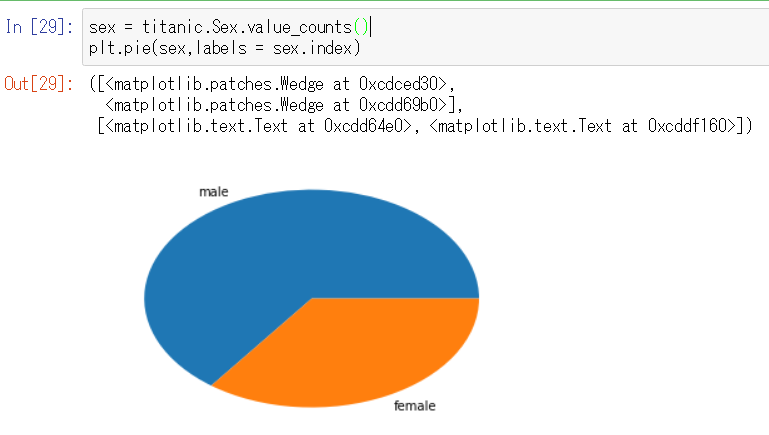
plt.axis('equal')で解決
参考
上記以外にも円グラフのあれこれが載っている
http://pythondatascience.plavox.info/matplotlib/%E5%86%86%E3%82%B0%E3%83%A9%E3%83%95
savefigについて
透過PNGにしたい
plt.savefig('hoge.png',transparent=True)