1.概要
株や仮想通貨が売り時 or 買い時 を分類するモデルを作ってみようと思ったのですが、まず学習用の正解データを作らなければならないことに気づきました。
そこで、チャート上でいう「下にとがっている点」に「買い時ラベル」、「上にとがっている点」に「売り時ラベル」がつくようなコードを書いてみました。
2.コード
株や仮想通貨の時系列データに、以下の6つにクラス分けしてみたいと思います。
(必要なラベルは 売り時 or 買い時 or それ以外 だけかもですが…)
- 1:売り時
- 2:強い上昇
- 3:上昇
- 4:下降
- 5:強い下降
- 6:買い時
まず最初に今回必要なモジュールをインポートします。
import datetime
from dateutil.relativedelta import relativedelta
import yfinance as yf
import numpy as np
import matplotlib.pyplot as plt
yahooファイナンスのライブラリを使って時系列データを取得します。
ここでは例としてビットコインのデータを取得します。
# 取得するデータをビットコインに指定
tickers = ['BTC-JPY']
# 取得終了日
end = datetime.date.today()
# 取得開始日(10年前)
start = end - relativedelta(years=10)
# データの取得を実行 、結果を`df`に代入
df = yf.download(tickers, start=start, end=end)
下準備として、以下3つの列を追加します。
- diff1:終値の1階差分
- diff2:終値の2階差分
- trend_class:クラス分け用のラベルが入る列。いったん NaN で初期化
# Closeの差分データを算出し、diff1という新たな列に代入
df['diff1'] = df['Close'].diff()
# diff1の差分データを算出し、diff2という新たな列に代入
df['diff2'] = df['diff1'].diff()
# trend_classという列を作成し、データをNaNで初期化
df['trend_class'] = np.nan
diff1(終値の1階差分)が2日連続で正の場合はその点を上昇トレンドとしてラベル3、負の場合はその点を下降トレンドとしてラベル4をつけます。
どのラベルもつかず、trend_class が NaN の場合は、直後の非欠損値で置き換えます。
(ここの「XX日連続」や「XX日中XX」を変えることで、結果も結構変わります。)
# diff1列を使ってrollingを適用し、条件に基づいてtrend_classを設定
def classify_trend(window):
    threshold = int(len(window))
    pos_count = (window > 0).sum()
    neg_count = (window < 0).sum()
    if pos_count >= threshold:
        return 3
    elif neg_count >= threshold:
        return 4
    else:
        return np.nan
df['trend_class'] = df['diff1'].rolling(window=2).apply(classify_trend, raw=True)
df['trend_class'] = df['trend_class'].bfill()
さらに trend_class がラベル3(上昇トレンド)かつ、diff1(終値の2階差分)が正かつ、diff2(終値の2階差分)が正の場合は、強い上昇トレンドにあるとしてその点をラベル2にします。
(前日よりもさらに大きい幅で上昇しているため)
逆に trend_class がラベル4(下降トレンド)かつ、diff1(終値の2階差分)が負かつ、diff2(終値の2階差分)が負の場合は、強い下降トレンドにあるとしてその点をラベル2にします。
# dfのデータを1行ずつ確認し、条件に基づいてtrend_classを更新
for i in range(1, len(df)):
    if df['trend_class'].iloc[i] == 3 and df['diff1'].iloc[i] > 0 and df['diff2'].iloc[i] > 0:
        df.at[df.index[i], 'trend_class'] = 2
    elif df['trend_class'].iloc[i] == 4 and df['diff1'].iloc[i] < 0 and df['diff2'].iloc[i] < 0:
        df.at[df.index[i], 'trend_class'] = 5
最後に上昇トレンド(ラベル2,3) → 下降トレンド(ラベル4,5)に変化する点を売り時としてラベル1にします。
逆に下降トレンド(ラベル4,5) → 上昇トレンド(ラベル2,3)に変化する点を買い時としてラベル6にします。
# trend_classの変化点を検出して更新
for i in range(1, len(df) - 1):
    if (df['trend_class'].iloc[i] in [2, 3]) and (df['trend_class'].iloc[i + 1] in [4, 5]):
        df.at[df.index[i], 'trend_class'] = 1
    elif (df['trend_class'].iloc[i] in [4, 5]) and (df['trend_class'].iloc[i + 1] in [2, 3]):
        df.at[df.index[i], 'trend_class'] = 6
ここまでの結果を確認します。
見えやすさのために直近半年くらいのデータに絞ってみます。
# 直近のデータ確認
df = df.tail(180)
print(df)
                  Open        High         Low       Close   Adj Close          Volume      diff1      diff2  trend_class
Date
2024-05-17  10223451.0  10326851.0  10031225.0  10136792.0  10136792.0   4906361601001   -88414.0  -679314.0          5.0
2024-05-18  10136748.0  10491554.0  10145188.0  10436284.0  10436284.0   4362926555869   299492.0   387906.0          4.0
2024-05-19  10438516.0  10490523.0  10377840.0  10421010.0  10421010.0   2601683785160   -15274.0  -314766.0          5.0
2024-05-20  10420562.0  10538310.0  10256523.0  10323983.0  10323983.0   2998373708858   -97027.0   -81753.0          5.0
2024-05-21  10324041.0  11177707.0  10302802.0  11174654.0  11174654.0   6858338601112   850671.0   947698.0          4.0
...                ...         ...         ...         ...         ...             ...        ...        ...          ...
2024-11-08  11672155.0  11757562.0  11477265.0  11625945.0  11625945.0   9721004336154   -46518.0 -1215316.0          3.0
2024-11-09  11625635.0  11801052.0  11581242.0  11688108.0  11688108.0   8425227731126    62163.0   108681.0          2.0
2024-11-10  11689744.0  11744171.0  11567248.0  11720678.0  11720678.0   4428442224534    32570.0   -29593.0          3.0
2024-11-11  11720171.0  12445996.0  11690077.0  12305469.0  12305469.0  12626034745346   584791.0   552221.0          2.0
2024-11-12  13623837.0  13800385.0  13102732.0  13353579.0  13353579.0  23548624109568  1048110.0   463319.0          2.0

[180 rows x 9 columns]
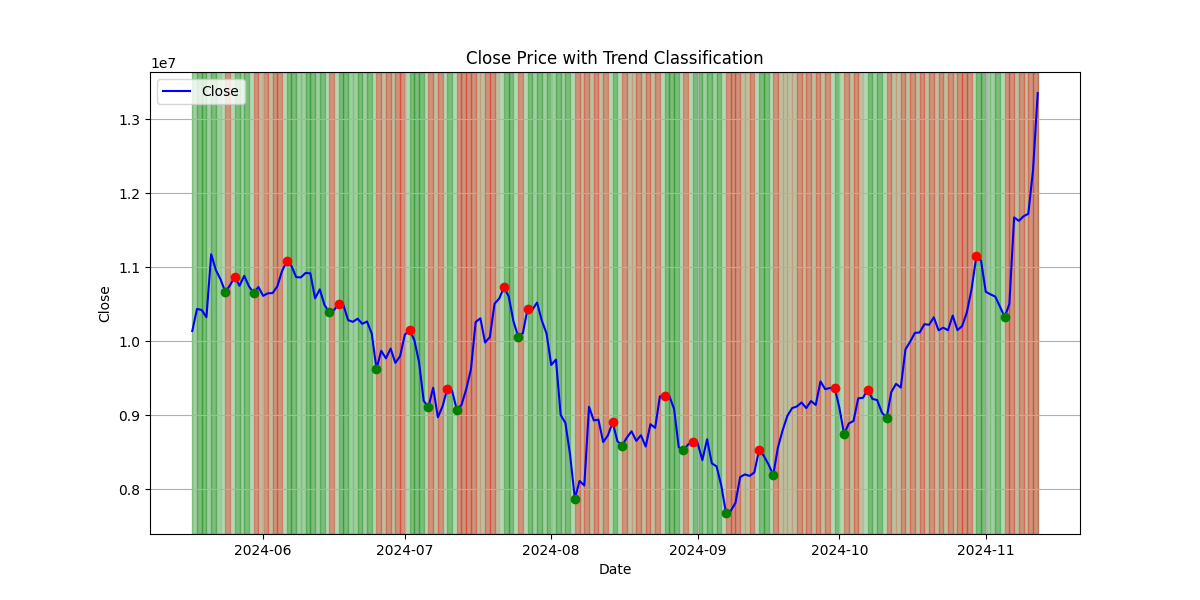
グラフでも見てみます。
終値を折れ線グラフとして表示し、上昇トレンド区間の背景を薄い赤、下降トレンド区間の背景を薄い緑にします。
また、売り時に赤いマーカー、買い時に緑のマーカーをつけます。
# Closeの折れ線グラフを作成
plt.figure(figsize=(12, 6))
plt.plot(df.index, df['Close'], label='Close', color='blue')

# 背景色を設定
for i in range(len(df)):
    current_class = df['trend_class'].iloc[i]
    if current_class == 2:
        plt.axvspan(df.index[i-1], df.index[i], color='red', alpha=0.3)
    elif current_class == 3:
        plt.axvspan(df.index[i-1], df.index[i], color='red', alpha=0.1)
    elif current_class == 4:
        plt.axvspan(df.index[i-1], df.index[i], color='green', alpha=0.1)
    elif current_class == 5:
        plt.axvspan(df.index[i-1], df.index[i], color='green', alpha=0.3)

# マーカーを追加
for i in range(len(df)):
    if df['trend_class'].iloc[i] == 1:
        plt.plot(df.index[i], df['Close'].iloc[i], 'ro')
    elif df['trend_class'].iloc[i] == 6:
        plt.plot(df.index[i], df['Close'].iloc[i], 'go')

plt.xlabel('Date')
plt.ylabel('Close')
plt.title('Close Price with Trend Classification')
plt.legend()
plt.grid(True)
plt.show()
グラフはこんな感じ

割と特徴は捉えられてる気がする(たぶん)
今回特に高度なライブラリは使わず、diff関数をごちゃごちゃ組み合わせるだけでしたが、ある程度の結果は得られたのではと思います。