PyQtGraphについて
は、ここに書きました。が、放置しすぎたので仕切り直しで…。コード中心にざっくりまとめます。
その1 作図まで
import sys
from PySide.QtCore import *
from PySide.QtGui import *
import pyqtgraph as pg
class GraphWindow(QMainWindow):
def __init__(self, parent = None):
super(GraphWindow, self).__init__(parent)
## 1 PlotWidgetを作成する
pw = pg.PlotWidget()
## 1 ウィンドウにウィジェットを設定する
self.setCentralWidget(pw)
## 1 plotItemを呼び出す
p1 = pw.plotItem
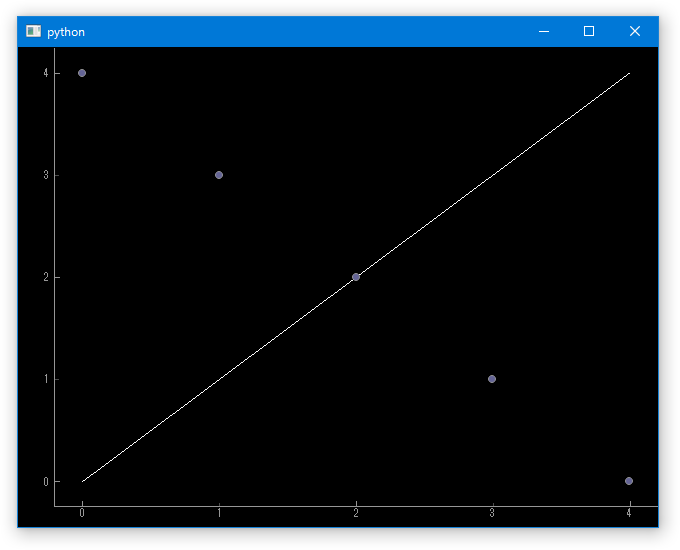
## 1 散布図と折れ線グラフを描写する
p1.addItem(pg.PlotCurveItem(x = [0, 1, 2, 3 ,4],
y = [0, 1, 2, 3 ,4]))
p1.addItem(pg.ScatterPlotItem(x = [0, 1, 2, 3 ,4],
y = [4, 3, 2, 1, 0]))
if __name__ == '__main__':
# Qt Applicationを作ります
app = QApplication(sys.argv)
# formを作成して表示します
mainWin = GraphWindow()
mainWin.show()
# Qtのメインループを開始します
sys.exit(app.exec_())