import sys
from PySide.QtCore import *
from PySide.QtGui import *
import pyqtgraph as pg
class GraphWindow(QMainWindow):
def __init__(self, parent = None):
super(GraphWindow, self).__init__(parent)
# 1 PlotWidgetを作成する
pw = pg.PlotWidget()
# 1 ウィンドウにウィジェットを設定する
self.setCentralWidget(pw)
# 1 plotItemを呼び出す
p1 = pw.plotItem
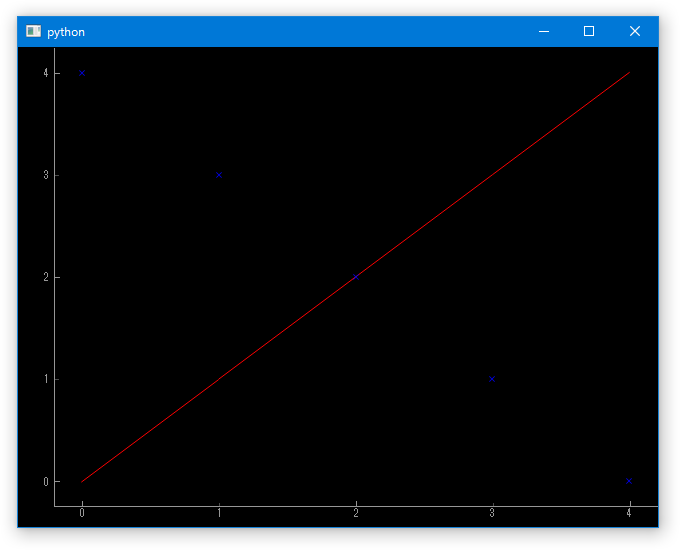
# 1 散布図と折れ線グラフを描写する
## 2 プロットの詳細を設定する
p1.addItem(pg.PlotCurveItem(x = [0, 1, 2, 3 ,4],
y = [0, 1, 2, 3 ,4],
pen = pg.mkPen(color = "r", style = Qt.SolidLine),
antialias = True))
p1.addItem(pg.ScatterPlotItem(x = [0, 1, 2, 3 ,4],
y = [4, 3, 2, 1, 0],
symbol = "x",
pen = pg.mkPen(None),
brush = pg.mkBrush("b"),
size = 7.5,
antialias = True))
if __name__ == '__main__':
# Qt Applicationを作ります
app = QApplication(sys.argv)
# formを作成して表示します
mainWin = GraphWindow()
mainWin.show()
# Qtのメインループを開始します
sys.exit(app.exec_())