このメモの狙い
サンキー図1(サンキー・ダイアグラム)は、複数ステップでの物やエネルギーの変遷を表現する図です。エネルギー変換の収支や熱回路網での熱流などを表示するのに適しています。サンキー図を作成できるライブラリーは2 3 4 5 いくつもあります。ただ、d3 ビギナーにとっては、ドキュメントやネット上の説明だけでは、カスタマイズの仕方がよくわからず、試行錯誤が必要でした。
ここでは、javascript ライブラリーである d3 をベースにした d3-sankey のカスタマイズについてのメモを書きました。
基本的に自分が d3 とこのライブラリーを理解するための勉強メモなので、初心者以外の人にとっては当たり前のことを冗長に書いています。
このライブラリ(d3-sankey-diagram)を選んだ理由
- IPython Sankey diagram widget があるので、 python と組み合わせて利用する可能性があると考えたからです。機能説明 はこちら。ただし実際には javascript のコードを書いてしまったので、このメモで作った図の仕上がりには、widget では実現できない機能も盛り込んだものになっています。
- d3 ベースの sankey ライブラリーの中で、d3-sankey-diagram だけが、リンクを、ノード id 名で指定できます。例えば、
{"source": "1co", "target": "2op", "value": 7273},( 1 Coal, 2 Oil prodeuct などの意味を持たせられる。)他のライブラリーだと、{"source": 1, "target": 3, "value": 633}などのように、リンクの指定にノードの index を使わないといけないので、データの可読性が低くなります。
はじめの一歩
-
テストをするにも、http サーバーが要ります。Readme.md に "Or download the standalone bundle and include in your page as " とあるように、javascript ライブラリをローカルから読み込みます。python 3 系の場合のローカルサーバー起動コマンドは、以下のものです。html (と json ファイル)があるディレクトリに移動して、
python -m http.server 8080として http サーバーを起動します。
ブラウザでhttp://localhost:8080/Japanese_energy_2016_sankey01.htmlを開いて、手元の html ファイルの動作を確認できます。 -
問題切り分けを簡単にしながら進めるために、最初のうちは、データを javascript の配列として同じ html ファイルに書き込んで、d3-sankey-diagram の挙動を理解することを行いました。
-
Chrome (windows) で、Ctrl+Shift+I で開くデベロッパー・ツールを使って、エレメントの様子を見たり、動くコードの挙動を見たり、Console でコードのフラグメントを評価してみたりして、間違いを修正していきます。
扱うデータについて
データは例題からのコピー&ペーストで済ませるのではなく、日本版のエネルギー統計を探して、データ作成からトライしました。ここでは「データ総合エネルギー統計」(エネルギーバランス表)の解読を試みました。
http://www.enecho.meti.go.jp/statistics/total_energy/results.html#headline2
エクセル形式で配布されているデータから、タブ 「(簡易表)エネルギー単位表(本表)」を利用しました。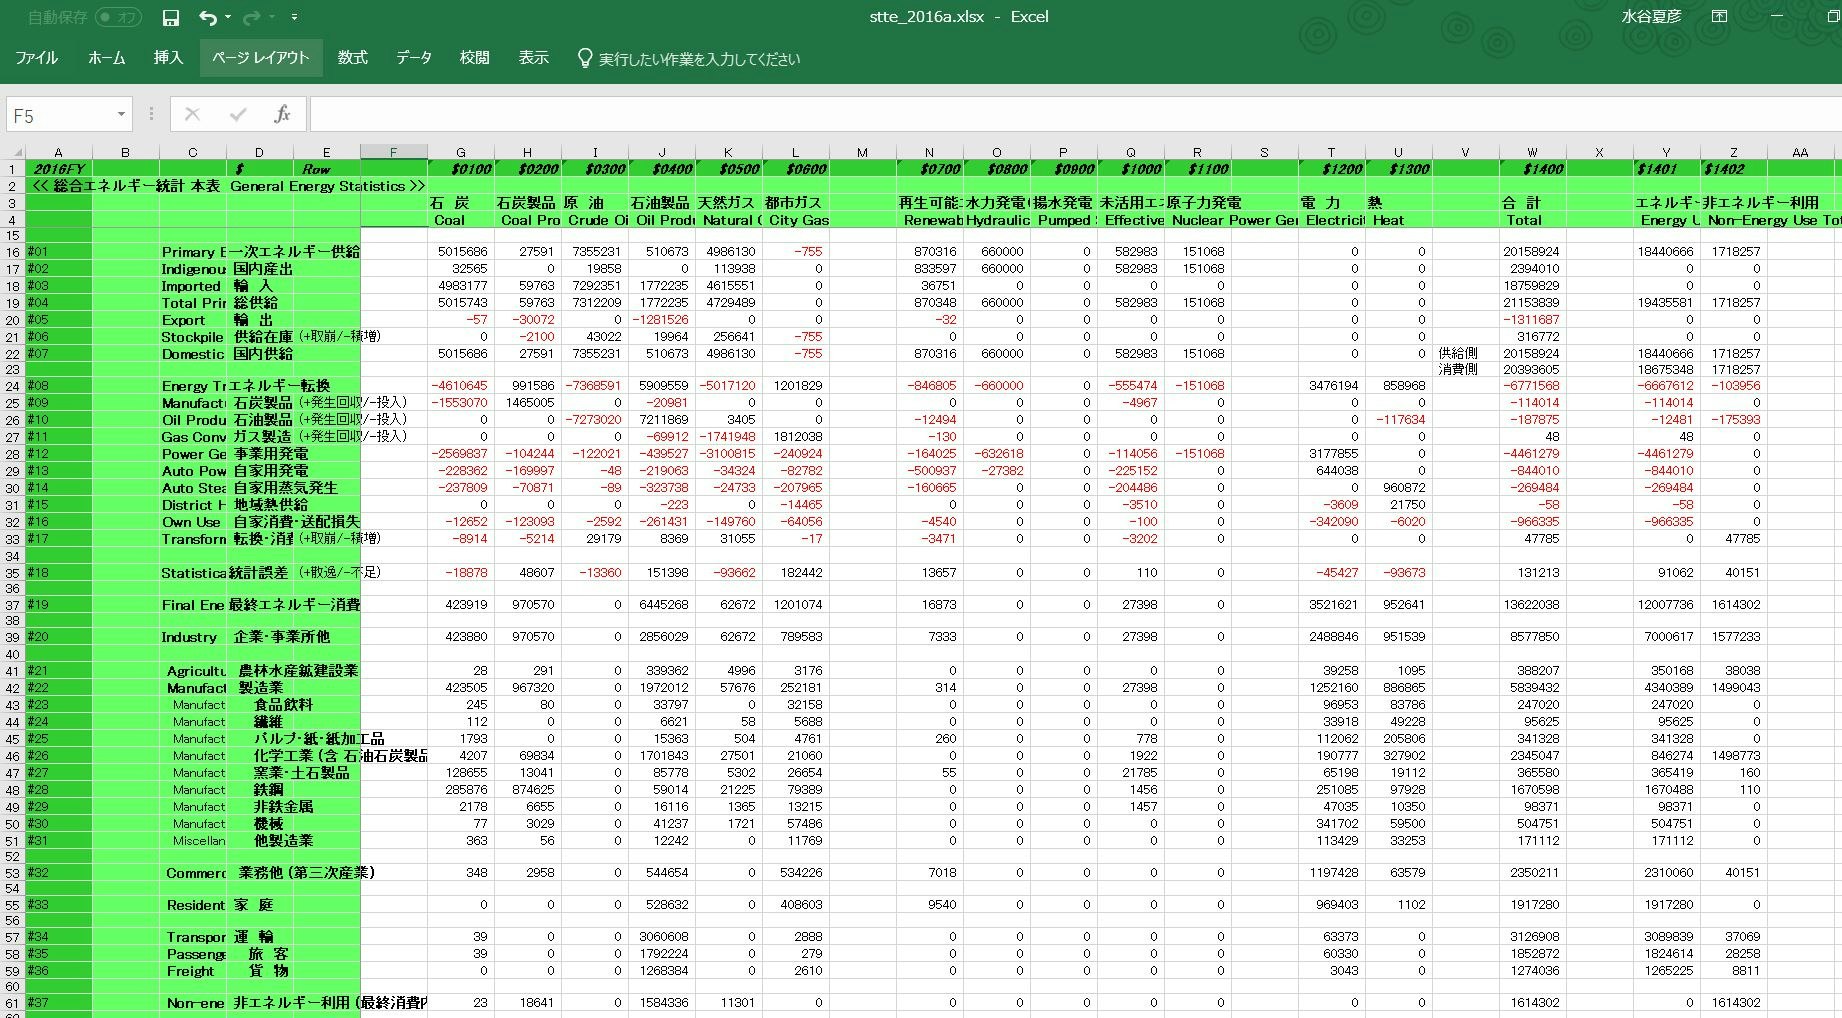
簡易とはいえ、データとして 37 行、14 列の表なので、更にデータを絞り込んでいくことを考えます。
データの構造を確認
ある列(例えば「原油」)を選んで上から辿っていくと、22行目の国内供給が、25行目から32行目までの形態へとエネルギー変換され、(変換元ではマイナスとなり、変換先の列ではプラスとなる)最後に、37 行目以降で企業・事業所、家庭、運輸という部門で消費されるという流れです。
ただし、小計とその内訳が入り混じって配置され、区別は見出しの字下げなどで行われています。また、エクセルシートの中である列の数値の sum() をとったときにゼロになるようには、符号が定義されていません。
大項目の間のバランスを捉えると、「一次エネルギー供給」+「エネルギー転換」(使用したらマイナス) = 「最終エネルギー消費」+「統計誤差」が大半の列で成立しています。(この解釈でも、完全には整合しない列も残りました。)
次にエネルギー変換の一行だけを取り出して眺めると、右端近くの「合計」の列はマイナスになっています。この数値がエネルギー変換の際のロスを表しています。発電のロスが(原理的に)大きいことが読み取れます。
単位を 3 桁ずらす
概略の数字で全体像をとらえるための可視化を目的として、単位を TJ (テラジュール: 10の12乗ジュール)から 単位を PJ (ペタジュール: 10の15乗ジュール)に変換し、さらにサンキー図には、50 PJ 以上のエネルギーの流れだけを記載することとしました。
グループ分けの指針
エネルギー変換の中で、一旦別の製品に変換された後で、発電に使われるものがあるので、エネルギー変換のブロックを1段階目の「石油製品」、「石炭製品」、「都市ガス」という一つ目のグループと、2段階目の「事業用発電」「自家用発電」、「自家用蒸気」、「地域熱供給」という2つめのグループに分けることができます。(グループ分けを明示的に適用するのは、中盤以降です)
初期バージョン
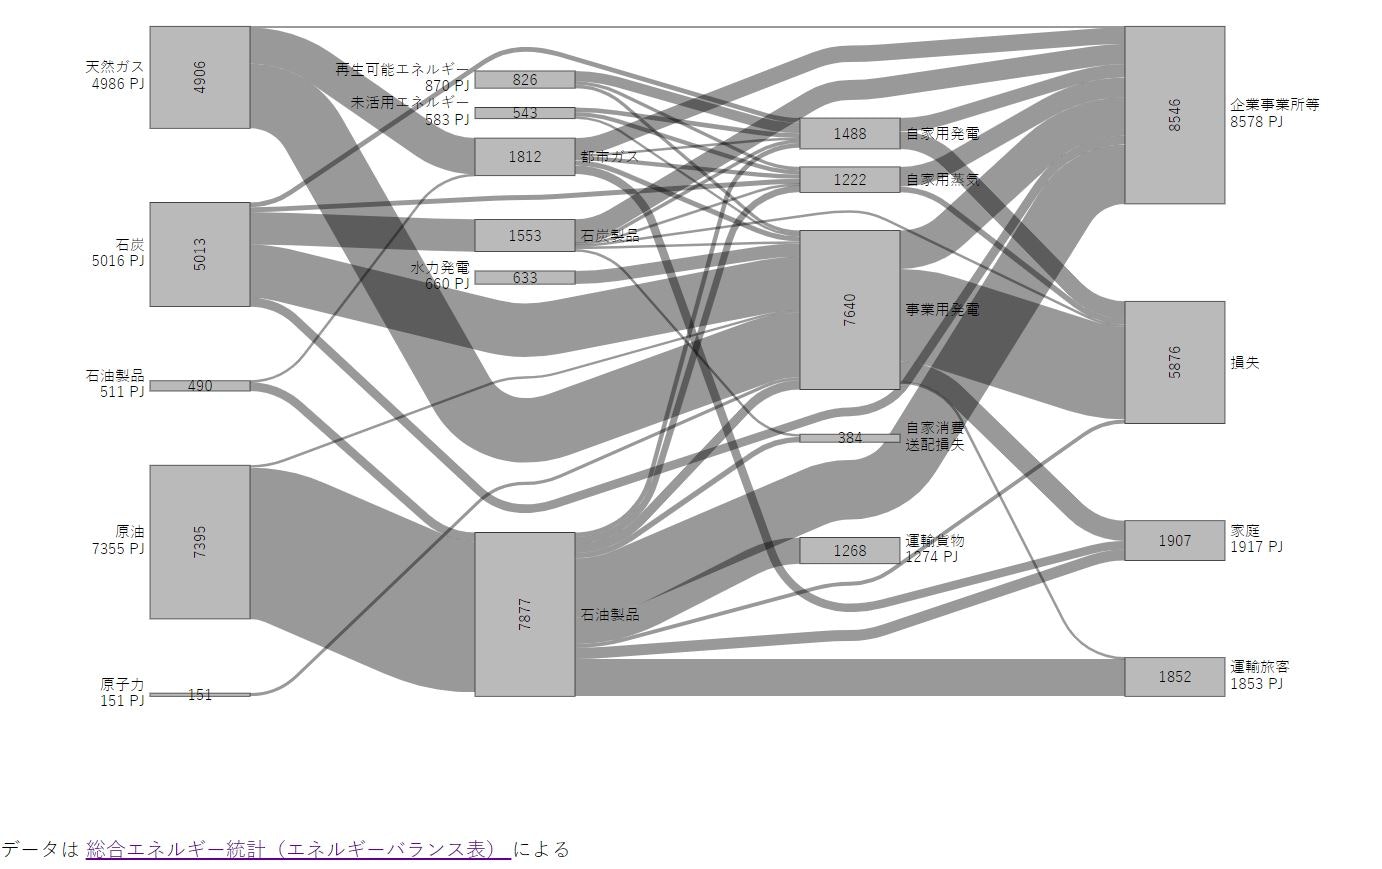
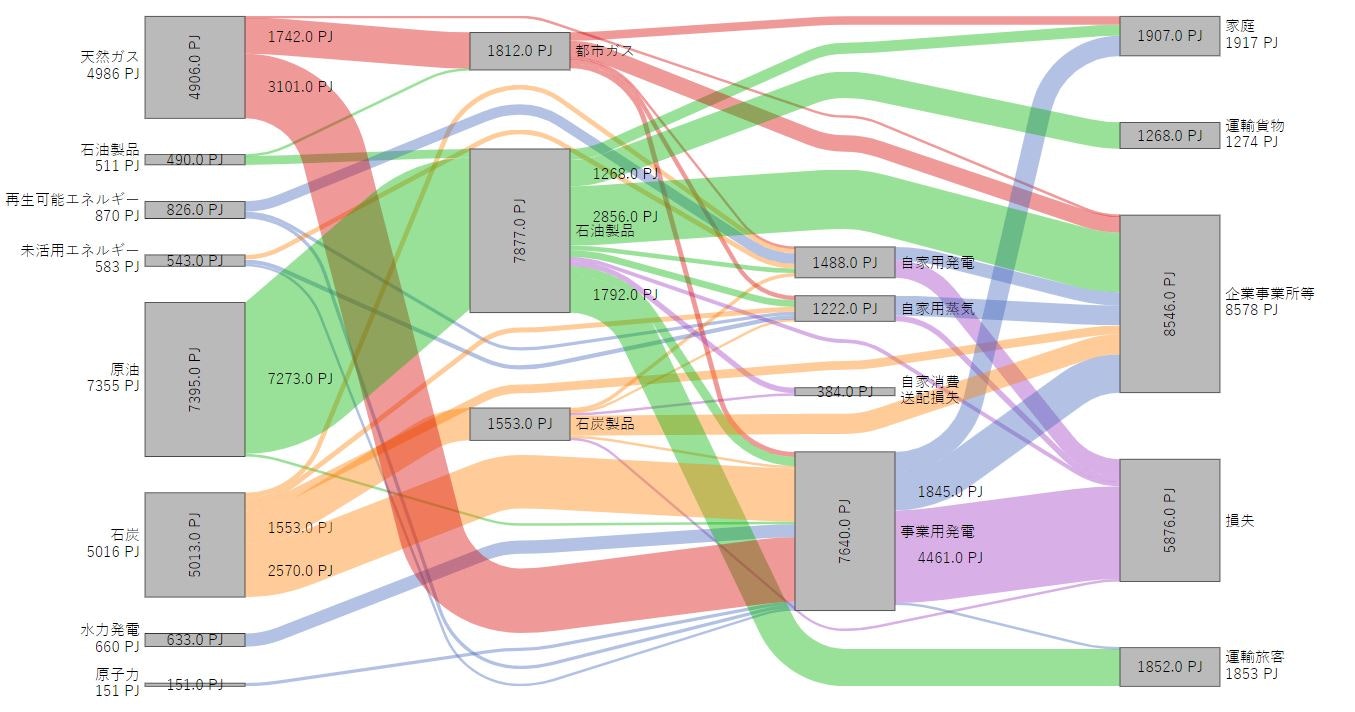
ノードと 50 PJ 以上のリンクだけを抽出したデータ構造を埋め込んだ最初のバージョンが、Japanese_energy_2016_sankey_01.html です。2行で表示したい title 項目については改行コードを埋め込んだ文字列を使っています。
<!DOCTYPE html>
<meta charset="utf-8">
<head>
<style>
 h1 {
    font-weight: normal;
    font-size: 2.5em;
 }
 .links path {
     opacity: 0.4;
 }

 .nodes text, .link text {
     font-family: sans-serif;
     font-size: 9pt !important;
 }

 .node-body {
   fill: #bbb;
   stroke: black;
   stroke-width: 0.5px;
 }

 .group rect {
   fill: rgb(39, 174, 214);
   opacity: 0.2;
 }
</style>
</head>
<body>
<h1>
日本のエネルギーバランス・フロー概要(2015年度)
</h1>
<div id="sankey" class="sankey">
<svg width="1200" height="700"></svg>

<p class="source"> データは
<a href="http://www.enecho.meti.go.jp/statistics/total_energy/results.html#headline2">
総合エネルギー統計(エネルギーバランス表) </a> による
</p>
</div>
<script src="https://d3js.org/d3.v4.js" charset="utf-8"></script>
<script src="d3-sankey-diagram.min.js" charset="utf-8"></script>
<script>
// Data
var energy = {
  nodes: [
     {"id": "1np", "title": "原子力\n151 PJ"},
     {"id": "1ru", "title": "未活用エネルギー\n583 PJ"},
     {"id": "1hp", "title": "水力発電\n660 PJ"},
     {"id": "1re", "title": "再生可能エネルギー\n870 PJ"},
     {"id": "1ng", "title": "天然ガス\n4986 PJ"},
     {"id": "1op", "title": "石油製品\n511 PJ"},
     {"id": "1co", "title": "原油\n7355 PJ"},
     {"id": "1cl", "title": "石炭\n5016 PJ"},
     {"id": "2cp", "title": "石炭製品"},
     {"id": "2op", "title": "石油製品"},
     {"id": "2cg", "title": "都市ガス"},
     {"id": "3pg", "title": "事業用発電"},
     {"id": "3ap", "title": "自家用発電"},
     {"id": "3as", "title": "自家用蒸気"},
     {"id": "3ol", "title": "自家消費\n送配損失"},
     {"id": "4hh", "title": "家庭\n1917 PJ"},
     {"id": "4tp", "title": "運輸旅客\n1853 PJ"},
     {"id": "4tl", "title": "運輸貨物\n1274 PJ"},
     {"id": "4bo", "title": "企業事業所等\n8578 PJ"},
     {"id": "4ls", "title": "損失"}
	 ],
   links: [
     {"source": "1hp", "target": "3pg", "type": "3", "value": 633},
     {"source": "1ru", "target": "3pg", "type": "3", "value": 114},
     {"source": "1np", "target": "3pg", "type": "3", "value": 151},
     {"source": "1cl", "target": "2cp", "type": "0", "value": 1553},
     {"source": "1co", "target": "2op", "type": "1", "value": 7273},
     {"source": "1op", "target": "2cg", "type": "1", "value": 70},
     {"source": "1op", "target": "2op", "type": "1", "value": 420},
     {"source": "1ng", "target": "2cg", "type": "2", "value": 1742},
     {"source": "1cl", "target": "3pg", "type": "0", "value": 2570},
     {"source": "2cp", "target": "3pg", "type": "0", "value": 104},
     {"source": "1co", "target": "3pg", "type": "1", "value": 122},
     {"source": "2op", "target": "3pg", "type": "1", "value": 440},
     {"source": "1ng", "target": "3pg", "type": "2", "value": 3101},
     {"source": "2cg", "target": "3pg", "type": "2", "value": 241},
     {"source": "1re", "target": "3pg", "type": "3", "value": 164},
     {"source": "1re", "target": "3as", "type": "3", "value": 161},
     {"source": "1cl", "target": "3ap", "type": "0", "value": 228},
     {"source": "2cp", "target": "3ap", "type": "0", "value": 170},
     {"source": "2op", "target": "3ap", "type": "1", "value": 219},
     {"source": "2cg", "target": "3ap", "type": "2", "value": 83},
     {"source": "1re", "target": "3ap", "type": "3", "value": 501},
     {"source": "1ru", "target": "3ap", "type": "0", "value": 225},
     {"source": "1cl", "target": "3as", "type": "0", "value": 238},
     {"source": "2cp", "target": "3as", "type": "0", "value": 71},
     {"source": "2op", "target": "3as", "type": "1", "value": 324},
     {"source": "2cg", "target": "3as", "type": "2", "value": 208},
     {"source": "1ru", "target": "3as", "type": "3", "value": 204},
     {"source": "2cp", "target": "3ol", "type": "4", "value": 123},
     {"source": "2op", "target": "3ol", "type": "4", "value": 261},
     {"source": "1cl", "target": "4bo", "type": "0", "value": 424},
     {"source": "2cp", "target": "4bo", "type": "0", "value": 971},
     {"source": "2op", "target": "4bo", "type": "1", "value": 2856},
     {"source": "1ng", "target": "4bo", "type": "2", "value": 63},
     {"source": "2cg", "target": "4bo", "type": "2", "value": 790},
     {"source": "3pg", "target": "4bo", "type": "3", "value": 1845},
     {"source": "2op", "target": "4hh", "type": "1", "value": 529},
     {"source": "2cg", "target": "4hh", "type": "2", "value": 409},
     {"source": "3pg", "target": "4hh", "type": "3", "value": 969},
     {"source": "2op", "target": "4tp", "type": "1", "value": 1792},
     {"source": "3pg", "target": "4tp", "type": "3", "value": 60},
     {"source": "2op", "target": "4tl", "type": "1", "value": 1268},
     {"source": "3ap", "target": "4bo", "type": "3", "value": 644},
     {"source": "3as", "target": "4bo", "type": "3", "value": 953},
     {"source": "2cp", "target": "4ls", "type": "4", "value": 114},
     {"source": "2op", "target": "4ls", "type": "4", "value": 188},
     {"source": "3pg", "target": "4ls", "type": "4", "value": 4461},
     {"source": "3ap", "target": "4ls", "type": "4", "value": 844},
     {"source": "3as", "target": "4ls", "type": "4", "value": 269}
   ]
//  (a)
 }
// Set up SVG  (b)
var layout = d3.sankey()
        .nodeWidth(80)
        .extent([[120, 10], [980, 680]]);

var diagram = d3.sankeyDiagram();

var el = d3.select('#sankey svg')
    .datum(layout(energy))
    .call(diagram);   // (c)
</script>
</body>
</html>
これをもとにして、javascript あるいはその中の Data に手を入れて、表示される情報を調整していきます。全部を書くとページがあまりにも冗長になるので、基本的に変更部分を書いていきます。以下の方針でコードの改変を記載します。
- javascript については、上の html の (b) の行から (c) の行までの全部を、新しいコードに置き換えます。
- Data (javascript 内) については、(a) 行以降に追記する内容だけを書いていきます。次の行の
}で連想配列を閉じている点に注意してください。
色、テキスト情報の調整など
関数 linkTitle を作りました。
色を使って属性を塗り分け、カーソルを当てたときの表示を読みやすくするための修正(ノード情報の2行目をリンク情報では捨てる)を加えました。
d3.sankeyDiagram() に対して、以下のようにして、この 3つの処理を加えました。
d3.sankeyDiagram()
   .linkTitle(linkTitle)
    .linkColor(function(d) { return color(d.type); });
    .nodeValue(function(d) { return fmt(d.value) + ' PJ'; })
Japanese_energy_2016_sankey_02.html
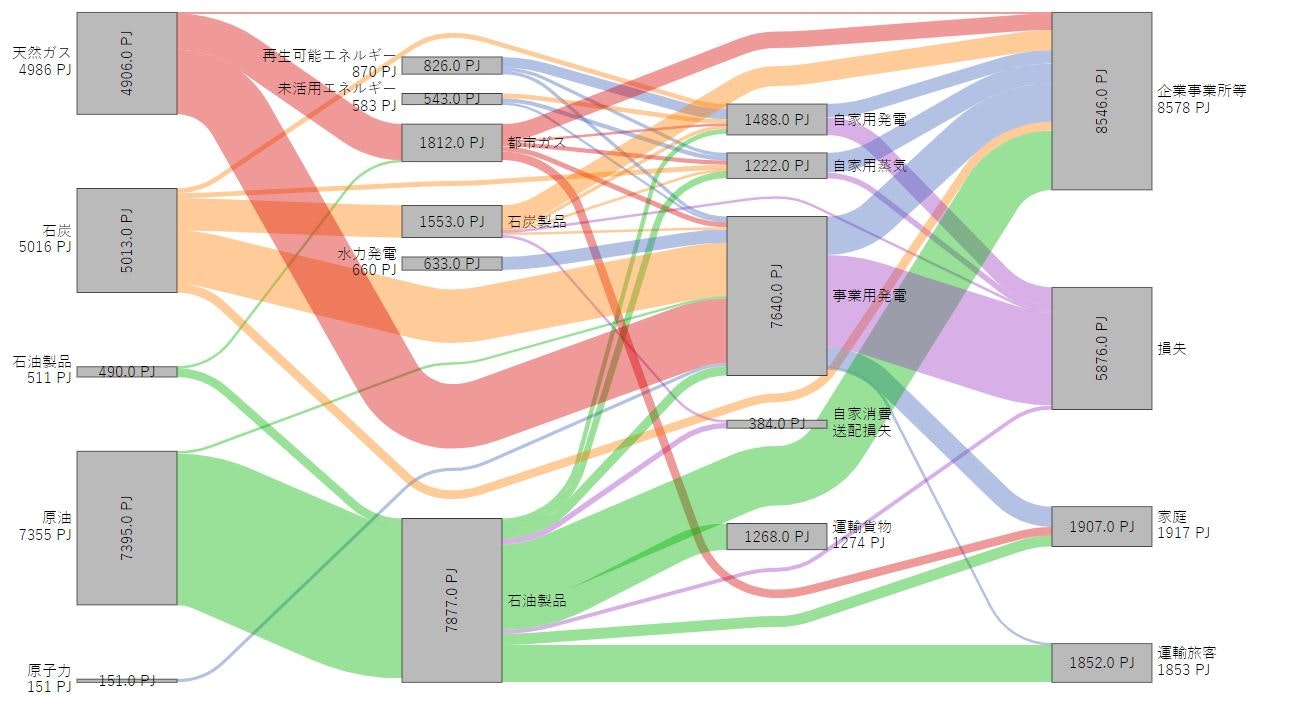
色分けによって、ずいぶん見やすくなったと思います。
javascript の修正
var layout = d3.sankey()
    .nodeWidth(80)
    .extent([[120, 10], [980, 680]]);

const fmtl = d3.format('.5')
function linkTitle(d) {
    const parts = [];
	var s_res = d.source.title.split( '\n' ); // Drop the second line of the title
    const sourceTitle = s_res[0];
	var t_res = d.target.title.split( '\n' ); // Drop the second line of the title
    const targetTitle = t_res[0];

    parts.push(`${sourceTitle} → ${targetTitle}`);
    parts.push(fmtl(d.value) + " PJ");
    return parts.join('\n');
}

var color = d3.scaleOrdinal(d3.schemeCategory10);
var fmt = d3.format('.1f');
var diagram = d3.sankeyDiagram()
	.linkTitle(linkTitle)
    .linkColor(function(d) { return color(d.type); })
    .nodeValue(function(d) { return fmt(d.value) + ' PJ'; });

var el = d3.select('#sankey svg')
    .datum(layout(energy))
    .call(diagram);
ただ、リンクにどれほどのエネルギーが流れているのかは、カーソルをあてたときだけのポップアップ表示なので、印刷して使うときには情報が少なくなります。(ここに数値を表示させる機能が準備された d3 ライブラリーは見つけられませんでした)
表示する情報の追加
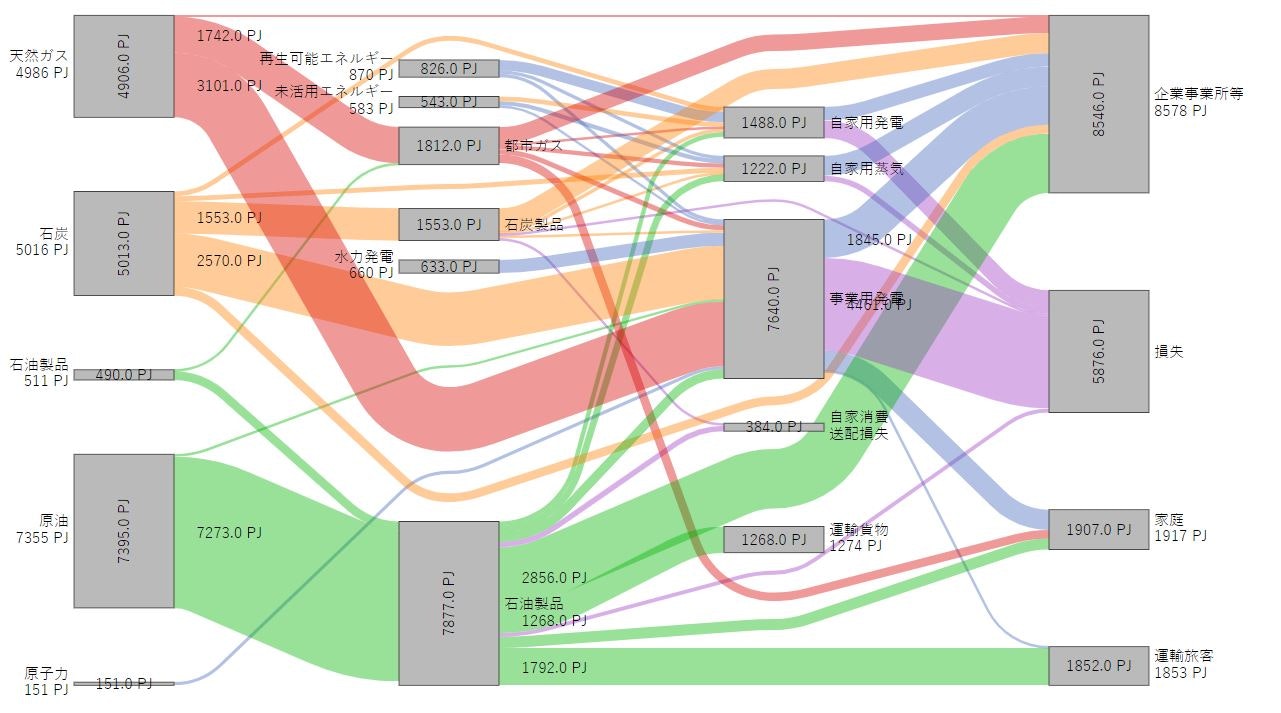
大きなエネルギーの流れについては、カーソルを当てないときにも、数値を示しておきたいと考えたので、1000 PJ 以上のlink には、テキストを追加しました。コードの最後のブロックを追加しています。
Japanese_energy_2016_sankey_03.html
javascript の修正
var layout = d3.sankey()
        .nodeWidth(80)
        .extent([[120, 10], [980, 680]]);

const fmtl = d3.format('.5')
function linkTitle(d) {
    const parts = [];
	var s_res = d.source.title.split( '\n' ); // Drop the second line of the title
    const sourceTitle = s_res[0];
	var t_res = d.target.title.split( '\n' ); // Drop the second line of the title
    const targetTitle = t_res[0];

    parts.push(`${sourceTitle} → ${targetTitle}`);
    parts.push(fmtl(d.value) + " PJ");
    return parts.join('\n');
}

var color = d3.scaleOrdinal(d3.schemeCategory10);
var fmt = d3.format('.1f');
var diagram = d3.sankeyDiagram()
		.linkTitle(linkTitle)
        .linkColor(function(d) { return color(d.type); })
        .nodeValue(function(d) { return fmt(d.value) + ' PJ'; });

var svg1 = d3.select('#sankey svg')
    .datum(layout(energy))
    .call(diagram);

var ltext = svg1.selectAll('.link')
	.filter(function(d) { return d.value > 1000 })
	.append("text")
      .attr("x", function(d) {return d.points[0].x;})
      .attr("y", function(d) {return d.points[0].y;})
      .attr("dx", "1.5em")
      .attr("dy", "0.4em")
      .text(function(d) { return fmt(d.value) + ' PJ'; });
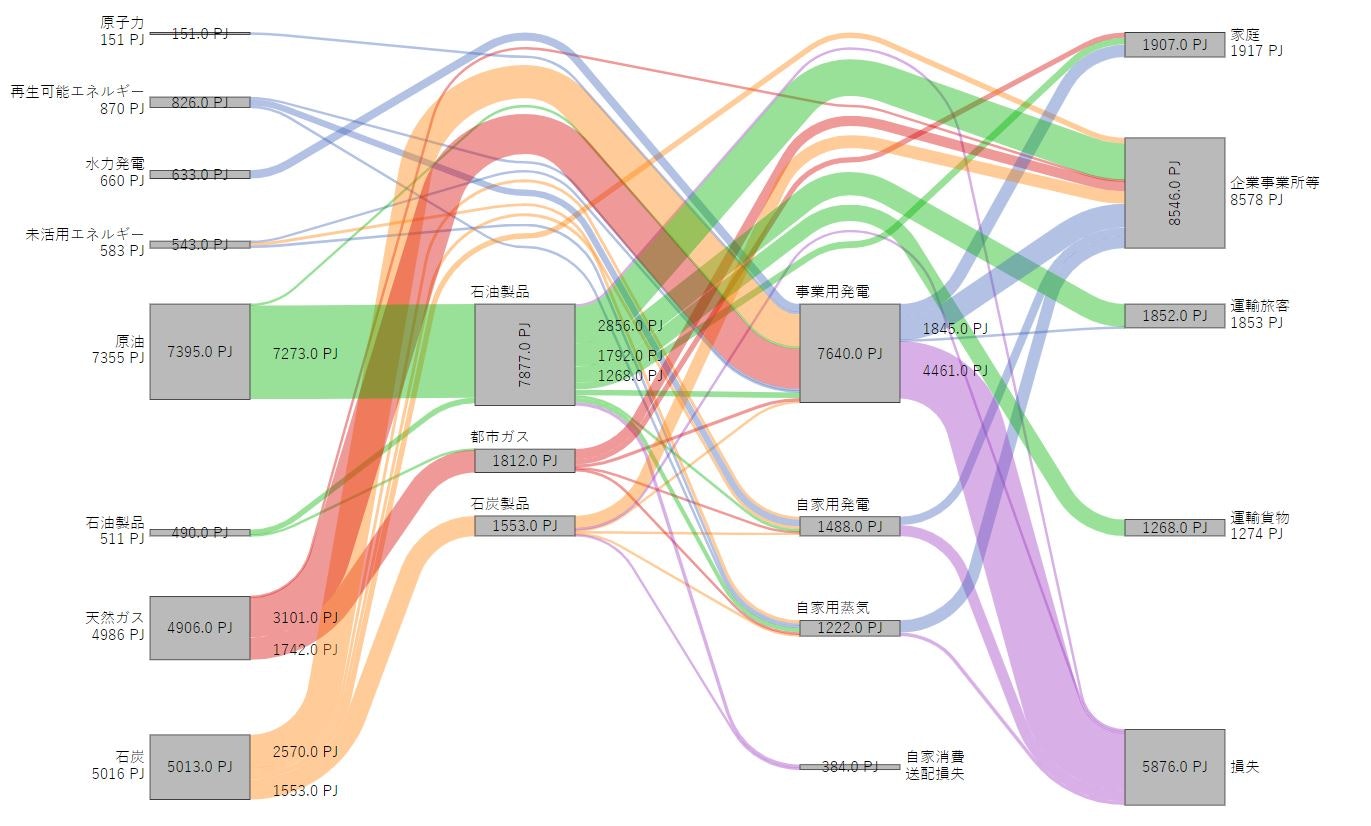
ただよく見ると、本当は左端に置きたい「水力発電」や右端に置きたい「運輸貨物」が、中間の列に配置されています。
layout の調整
ライブラリ説明の中で var layout = d3.sankey(); としているので、これを layout と呼びます。
rankSet
d3.sankey.rankSets([rankSets]); として rankSetsを明示的に設定することで、ノードがどの rank すなわち 「流れの中の階層」に位置するかを指定できます。rankSets はその場に配列を書き込むこともできますが、連想配列 energy に 配列を追加して、 energy.rankSets と呼び出すことにしました。
ここでは、「水力発電」などのエネルギー源を左端の列に、「運輸貨物」を右端の列に動かしました。
Japanese_energy_2016_sankey_04rs.html
var energy の内容追加
    , rankSets: [
     {"type": "same", "nodes": ["1cl", "1co", "1op", "1ng", "1re", "1hp", "1ru", "1np"]},
     {"type": "same", "nodes": ["2cp", "2op", "2cg"]},
     {"type": "same", "nodes": ["3pg", "3ap", "3as", "3ol"]},
     {"type": "same", "nodes": ["4hh", "4tp", "4tl", "4bo", "4ls"]}
   ]
javascript の修正
var layout = d3.sankey()
        .nodeWidth(80)
        .extent([[120, 10], [980, 680]])
	.rankSets(energy.rankSets);

const fmtl = d3.format('.5')
function linkTitle(d) {
    const parts = [];
	var s_res = d.source.title.split( '\n' ); // Drop the second line of the title
    const sourceTitle = s_res[0];
	var t_res = d.target.title.split( '\n' ); // Drop the second line of the title
    const targetTitle = t_res[0];

    parts.push(`${sourceTitle} → ${targetTitle}`);
    parts.push(fmtl(d.value) + " PJ");
    return parts.join('\n');
}

var color = d3.scaleOrdinal(d3.schemeCategory10);
var fmt = d3.format('.1f');
var diagram = d3.sankeyDiagram()
		.linkTitle(linkTitle)
        .linkColor(function(d) { return color(d.type); })
        .nodeValue(function(d) { return fmt(d.value) + ' PJ'; });

var svg1 = d3.select('#sankey svg')
    .datum(layout(energy))
    .call(diagram);

var ltext = svg1.selectAll('.link')
	.filter(function(d) { return d.value > 1000 })
	.append("text")
      .attr("x", function(d) {return d.points[0].x;})
      .attr("y", function(d) {return d.points[0].y;})
      .attr("dx", "1.5em")
      .attr("dy", "0.4em")
      .text(function(d) { return fmt(d.value) + ' PJ'; });
ordering
d3.sankey.ordering([ordering]); として orderingを明示的に設定することで、ノードがどの rank = 「流れの中の階層」に位置するかを指定できます。
並び順に対して、どのようにグルーピングするかを指定できます。
例えば、「運輸旅客」と「運輸貨物」は同じグループ(ライブラリの説明の中では、"band" と書いてあります) に属するようにすることができます。全部のノードを記載しておかないと、記載されていないノードが一列目に加えられてしまい、所望の配置にはなりません。rankSets よりも細かい指定になっているので rankSets の指定は無視されるようです。 rankSets に関連するコードは取り除くことにしました。
Japanese_energy_2016_sankey_04od.html
var energy の内容追加
   // rankSets は削除
  , order: [
        [["1np","1re", "1hp", "1ru"], ["1co", "1op"], ["1ng"], ["1cl"]],
        [[], ["2op", "2cg", "2cp"],[]],
        [[], ["3pg","3ap"], ["3as"], ["3ol"]],
        [["4hh", "4bo"], ["4tp", "4tl"], [], ["4ls"]]
   ],
    // 空っぽのバンド [] をどう使うかで、配置や取り回しが変わる。ここは、試行錯誤で調整
javascript の修正
var layout = d3.sankey()
        .nodeWidth(80)
        .extent([[120, 10], [980, 680]])
	    .ordering(energy.order);

const fmtl = d3.format('.5')
function linkTitle(d) {
    const parts = [];
	var s_res = d.source.title.split( '\n' ); // Drop the second line of the title
    const sourceTitle = s_res[0];
	var t_res = d.target.title.split( '\n' ); // Drop the second line of the title
    const targetTitle = t_res[0];

    parts.push(`${sourceTitle} → ${targetTitle}`);
    parts.push(fmtl(d.value) + " PJ");
    return parts.join('\n');
}

var color = d3.scaleOrdinal(d3.schemeCategory10);
var fmt = d3.format('.1f');
var diagram = d3.sankeyDiagram()
		.linkTitle(linkTitle)
        .linkColor(function(d) { return color(d.type); })
        .nodeValue(function(d) { return fmt(d.value) + ' PJ'; });

var svg1 = d3.select('#sankey svg')
    .datum(layout(energy))
    .call(diagram);

var ltext = svg1.selectAll('.link')
	.filter(function(d) { return d.value > 1000 })
	.append("text")
      .attr("x", function(d) {return d.points[0].x;})
      .attr("y", function(d) {return d.points[0].y;})
      .attr("dx", "1.5em")
      .attr("dy", "0.4em")
      .text(function(d) { return fmt(d.value) + ' PJ'; });
diagram の設定
ライブラリ説明の中で var diagram = d3.sankeyDiagram(); としているので、これを diagram と呼ぶことにします。
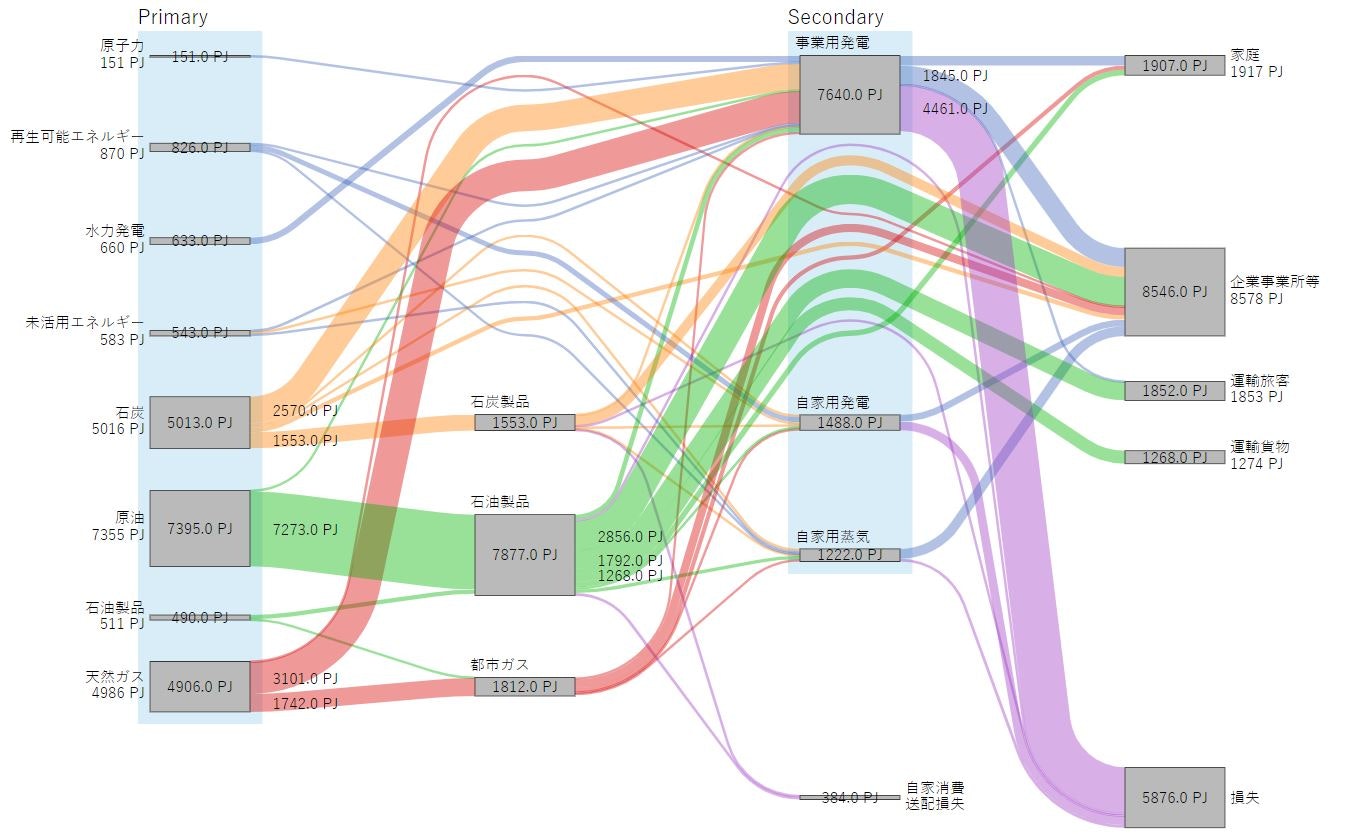
group の作成と表示
幾つかの node をまとめて group として表示する機能は、d3.sankeyDiagram().groups([groups]);
として呼び出せます。上で調整した layout よりも論理的なまとまりとしての意味合いを持たせているのでしょう。ここでは、投入されるエネルギーを「一次エネルギー」、そこから変換して生成された電力と熱を「二次エネルギー」として囲ってみました。
Japanese_energy_2016_sankey_05.html
var energy の内容追加
   , groups: [
     {"title": "Primary",
      "nodes": ["1cl", "1co", "1op", "1ng", "1re", "1hp", "1ru", "1np"]},
     {"title": "Secondary",
      "nodes": ["3pg", "3ap", "3as"]}
   ]
javascript の修正
var layout = d3.sankey()
        .nodeWidth(80)
        .extent([[120, 10], [980, 680]])
	    .ordering(energy.order);

const fmtl = d3.format('.5')
function linkTitle(d) {
    const parts = [];
	var s_res = d.source.title.split( '\n' ); // Drop the second line of the title
    const sourceTitle = s_res[0];
	var t_res = d.target.title.split( '\n' ); // Drop the second line of the title
    const targetTitle = t_res[0];

    parts.push(`${sourceTitle} → ${targetTitle}`);
    parts.push(fmtl(d.value) + " PJ");
    return parts.join('\n');
}

var color = d3.scaleOrdinal(d3.schemeCategory10);
var fmt = d3.format('.1f');
var diagram = d3.sankeyDiagram()
		.linkTitle(linkTitle)
        .linkColor(function(d) { return color(d.type); })
        .nodeValue(function(d) { return fmt(d.value) + ' PJ'; })
        .groups(energy.groups);
var svg1 = d3.select('#sankey svg')
    .datum(layout(energy))
    .call(diagram);

var ltext = svg1.selectAll('.link')
	.filter(function(d) { return d.value > 1000 })
	.append("text")
      .attr("x", function(d) {return d.points[0].x;})
      .attr("y", function(d) {return d.points[0].y;})
      .attr("dx", "1.5em")
      .attr("dy", "0.4em")
      .text(function(d) { return fmt(d.value) + ' PJ'; });
データを json に分離
データを json として読めるように変換します。先々、別のプログラムで json 形式のファイルを生成してサンキー図を描画させることを想定しているのですが、データの生成は今後の宿題です。
- javascript の修正
  var jsonFile = "http://localhost:8080/ja_energy.json";
  d3.json(jsonFile, function(energy) {
}
というブロックを作ります。json で読み込んだ内容に energy という名前をつけてアクセスできるのは、この括弧の内側だけです。これまではvar energy として書いていたので、javascript 内のどこからでも energy.node などのデータにアクセスできていたのとは、ここが大きな違いになります。
- javascript 内のデータブロックを別ファイルの json にするときには、key を "" で囲んで、
"node": []などとする必要がありました。
結果の表示は最後のものと変わらないので省略して、コードだけを転記します。最後なので省略なしです。
{
  "nodes": [
     {"id": "1np", "title": "原子力\n151 PJ"},
     {"id": "1ru", "title": "未活用エネルギー\n583 PJ"},
     {"id": "1hp", "title": "水力発電\n660 PJ"},
     {"id": "1re", "title": "再生可能エネルギー\n870 PJ"},
     {"id": "1ng", "title": "天然ガス\n4986 PJ"},
     {"id": "1op", "title": "石油製品\n511 PJ"},
     {"id": "1co", "title": "原油\n7355 PJ"},
     {"id": "1cl", "title": "石炭\n5016 PJ"},
     {"id": "2cp", "title": "石炭製品"},
     {"id": "2op", "title": "石油製品"},
     {"id": "2cg", "title": "都市ガス"},
     {"id": "3pg", "title": "事業用発電"},
     {"id": "3ap", "title": "自家用発電"},
     {"id": "3as", "title": "自家用蒸気"},
     {"id": "3ol", "title": "自家消費\n送配損失"},
     {"id": "4hh", "title": "家庭\n1917 PJ"},
     {"id": "4tp", "title": "運輸旅客\n1853 PJ"},
     {"id": "4tl", "title": "運輸貨物\n1274 PJ"},
     {"id": "4bo", "title": "企業事業所等\n8578 PJ"},
     {"id": "4ls", "title": "損失"}
	 ],
  "links": [
    {"source": "1hp", "target": "3pg", "type": "3", "value": "633"},
    {"source": "1ru", "target": "3pg", "type": "3", "value": "114"},
    {"source": "1np", "target": "3pg", "type": "3", "value": "151"},
    {"source": "1cl", "target": "2cp", "type": "0", "value": "1553"},
    {"source": "1co", "target": "2op", "type": "1", "value": "7273"},
    {"source": "1op", "target": "2cg", "type": "1", "value": "70"},
    {"source": "1op", "target": "2op", "type": "1", "value": "560"},
    {"source": "1ng", "target": "2cg", "type": "2", "value": "1742"},
    {"source": "1cl", "target": "3pg", "type": "0", "value": "2570"},
    {"source": "2cp", "target": "3pg", "type": "0", "value": "104"},
    {"source": "1co", "target": "3pg", "type": "1", "value": "122"},
    {"source": "2op", "target": "3pg", "type": "1", "value": "440"},
    {"source": "1ng", "target": "3pg", "type": "2", "value": "3101"},
    {"source": "2cg", "target": "3pg", "type": "2", "value": "241"},
    {"source": "1re", "target": "3pg", "type": "3", "value": "114"},
    {"source": "1cl", "target": "3ap", "type": "0", "value": "228"},
    {"source": "2cp", "target": "3ap", "type": "0", "value": "170"},
    {"source": "2op", "target": "3ap", "type": "1", "value": "219"},
    {"source": "2cg", "target": "3ap", "type": "2", "value": "83"},
    {"source": "1re", "target": "3ap", "type": "3", "value": "501"},
    {"source": "1hp", "target": "3ap", "type": "3", "value": "27"},
    {"source": "1ru", "target": "3ap", "type": "0", "value": "225"},
    {"source": "1re", "target": "3as", "type": "3", "value": "161"},
    {"source": "1cl", "target": "3as", "type": "0", "value": "238"},
    {"source": "2cp", "target": "3as", "type": "0", "value": "71"},
    {"source": "2op", "target": "3as", "type": "1", "value": "324"},
    {"source": "2cg", "target": "3as", "type": "2", "value": "208"},
    {"source": "1ru", "target": "3as", "type": "3", "value": "204"},
    {"source": "2cp", "target": "3ol", "type": "4", "value": "123"},
    {"source": "2op", "target": "3ol", "type": "4", "value": "261"},
    {"source": "1ng", "target": "3ol", "type": "4", "value": "150"},
    {"source": "2cg", "target": "3ol", "type": "4", "value": "64"},
    {"source": "1cl", "target": "4bo", "type": "0", "value": "424"},
    {"source": "2cp", "target": "4bo", "type": "0", "value": "971"},
    {"source": "2op", "target": "4bo", "type": "1", "value": "2856"},
    {"source": "1ng", "target": "4bo", "type": "2", "value": "63"},
    {"source": "2cg", "target": "4bo", "type": "2", "value": "790"},
    {"source": "3pg", "target": "4bo", "type": "3", "value": "1845"},
    {"source": "3as", "target": "4bo", "type": "3", "value": "952"},
    {"source": "3ap", "target": "4bo", "type": "3", "value": "644"},
    {"source": "2op", "target": "4hh", "type": "1", "value": "529"},
    {"source": "2cg", "target": "4hh", "type": "2", "value": "409"},
    {"source": "3pg", "target": "4hh", "type": "3", "value": "969"},
    {"source": "2op", "target": "4tp", "type": "1", "value": "1792"},
    {"source": "3pg", "target": "4tp", "type": "3", "value": "60"},
    {"source": "2op", "target": "4tl", "type": "1", "value": "1268"},
    {"source": "2cp", "target": "4ls", "type": "4", "value": "114"},
    {"source": "2op", "target": "4ls", "type": "4", "value": "188"},
    {"source": "3pg", "target": "4ls", "type": "4", "value": "4461"},
    {"source": "3ap", "target": "4ls", "type": "4", "value": "844"},
    {"source": "3as", "target": "4ls", "type": "4", "value": "269"}
  ],
  "order": [
    [["1np","1re", "1hp", "1ru"], ["1cl"], ["1co", "1op"], ["1ng"], []],
	[[], ["2cp"], ["2op"], ["2cg"], []],
	[["3pg"], ["3ap"], ["3as"], [], ["3ol"]],
	[["4hh", "4bo"], ["4tp", "4tl"], [], [], ["4ls"]]
   ],
   "rankSets": [
     {"type": "same", "nodes": ["1cl", "1co", "1op", "1ng", "1re", "1hp", "1ru", "1np"]},
     {"type": "same", "nodes": ["2cp", "2op", "2cg"]},
     {"type": "same", "nodes": ["3pg", "3ap", "3as", "3ol"]},
     {"type": "same", "nodes": ["4hh", "4tp", "4tl", "4bo", "4ls"]}
   ],
   "groups": [
     {"title": "Primary",
      "nodes": ["1cl", "1co", "1op", "1ng", "1re", "1hp", "1ru", "1np"]},
     {"title": "Secondary",
      "nodes": ["3pg", "3ap", "3as", "3hs"]}
   ]
}
<!DOCTYPE html>
<meta charset="utf-8">
<head>
<style>
 h1 {
    font-weight: normal;
    font-size: 2.5em;
 }
 .links path {
     opacity: 0.4;
 }

 .nodes text, .link text {
     font-family: sans-serif;
     font-size: 9pt !important;
 }

 .node-body {
   fill: #bbb;
   stroke: black;
   stroke-width: 0.5px;
 }

 .group rect {
   fill: rgb(39, 174, 214);
   opacity: 0.2;
 }
</style>
</head>
<body>
<h1>
日本のエネルギーバランス・フロー概要(2015年度)
</h1>
<div id="sankey" class="sankey">
<svg width="1200" height="700"></svg>

<p class="source"> データは
<a href="http://www.enecho.meti.go.jp/statistics/total_energy/results.html#headline2">
総合エネルギー統計(エネルギーバランス表) </a> による
</p>
</div>
<script src="https://d3js.org/d3.v4.js" charset="utf-8"></script>
<script src="d3-sankey-diagram.min.js" charset="utf-8"></script>
<script>
  // Set up SVG
  var svg = d3.select('svg');
  var width = +svg.attr('width');
  var height = +svg.attr('height');
  var margin = { top: 10, left: 120, bottom: 10, right: 100 };

  var layout = d3.sankey()
        .linkValue(function (d) { return d.value; })
        .nodeWidth(80)
        .extent([
          [margin.left, margin.top],
          [width - margin.left - margin.right, height - margin.top - margin.bottom]]);

  const fmtl = d3.format('.5')
  function linkTitle(d) {
    const parts = [];
    var s_res = d.source.title.split( '\n' ); // Drop the second line of the title
    const sourceTitle = s_res[0];
    var t_res = d.target.title.split( '\n' ); // Drop the second line of the title
    const targetTitle = t_res[0];

    parts.push(`${sourceTitle} → ${targetTitle}`);
    parts.push(fmtl(d.value) + " PJ");
    return parts.join('\n');
  }

  // Render
  var color = d3.scaleOrdinal(d3.schemeCategory10);
  var fmt = d3.format('.1f');
  var diagram = d3.sankeyDiagram()
    .linkMinWidth(function(d) { return 1; })
    .linkTitle(linkTitle)
    .nodeValue(function(d) { return fmt(d.value) + ' PJ'; })
    .linkColor(function(d) { return color(d.type); });

  // var jsonFile = "http://localhost:8080/ja_energy.json";
  // d3.json(jsonFile, function(energy) {
  d3.json('ja_energy.json', function(energy) {
    layout.ordering(energy.order)
    var svg1 = d3.select('#sankey svg')
        .datum(layout(energy))
        .call(diagram.groups(energy.groups));
	}
  );

  var ltext = svg1.selectAll('.link')
    .filter(function(d) { return d.value > 1000 })
    .append("text")
      .attr("x", function(d) {return d.points[0].x;})
      .attr("y", function(d) {return d.points[0].y;})
      .attr("dx", "1.5em")
      .attr("dy", "0.4em")
      .text(function(d) { return fmt(d.value) + ' PJ'; });

</script>
</body>
</html>
終わりに
- ここまで丁寧に追って、ライブラリの説明の記述が何を言っているのかわかるようになってきました。
- データを直接埋め込んで動作確認する状態から、データを json に分離するやり方とその際の(小さな)トラップがわかりました。
- 今後の宿題は、jupyter 連携に今回のような javascript 上での機能改造を取り込む方法。
- 現状では json を手打ちで作っているので、json ファイルを読むことの恩恵がない状態です。プログラム的なデータ生成も今後の宿題です。