1.はじめに
chartjs-plugin-datalabelsを使用していきます。
chart.jsのバージョンはchart.js@3.x以降が必要です。
本記事ではchart.js@3.0.0使用しています。
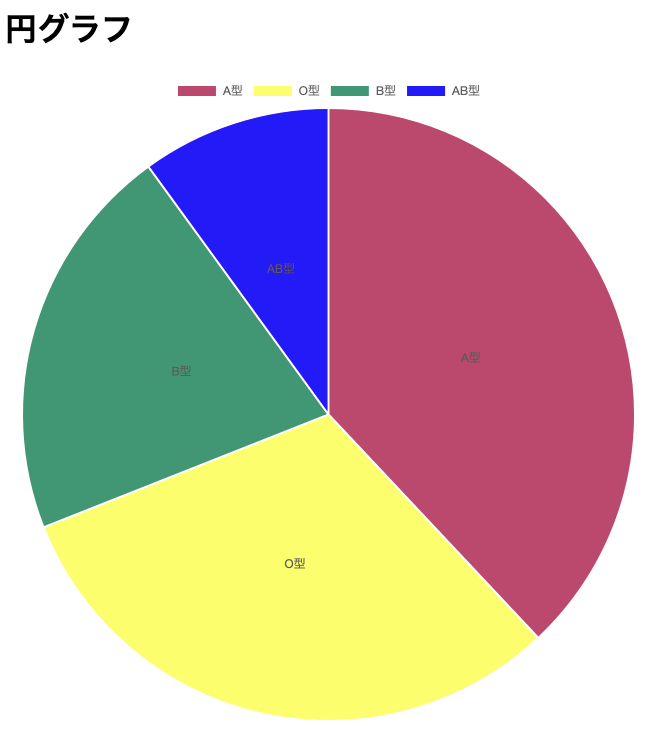
基本的な円グラフの、サンプル(chart.html)を示します。
<!DOCTYPE html>
<html lang="en">
<head>
  <meta charset="UTF-8">
  <meta http-equiv="X-UA-Compatible" content="IE=edge">
  <meta name="viewport" content="width=device-width, initial-scale=1.0">
  <script src="https://code.jquery.com/jquery-3.6.4.js"></script>
  <title>Chart.js</title>
</head>
<body>
  <h1>円グラフ</h1>
  <canvas id="myPieChart">

  <script src="https://cdn.jsdelivr.net/npm/chart.js@3.0.0/dist/chart.min.js"></script>
  <script>
    const ctx = document.getElementById("myPieChart");
    const myPieChart = new Chart(ctx, {
      type: 'pie', // 円グラフを使用
      data: {
        labels: ["A型", "O型", "B型", "AB型"],
        datasets: [{
          backgroundColor: [
            "#BB5179",
            "#FAFF67",
            "#58A27C",
            "#3C00FF"
          ],
          data: [38, 31, 21, 10]
        }]
      },
      options: {
          }
    });
  </script>
</body>
</html>
2.chartjs-plugin-datalabelsを適用してグラフ上に文字を表示
こちらchartjs-plugin-datalabelsの公式サイトになります。
https://chartjs-plugin-datalabels.netlify.app/guide/#table-of-contents
<script src="https://cdn.jsdelivr.net/npm/chartjs-plugin-datalabels@2.0.0 "><script>
をchart.jライブラリ下に追加
[ChartDataLabels]をプラグインオプションとして追加
<!DOCTYPE html>
<html lang="en">
<head>
  <meta charset="UTF-8">
  <meta http-equiv="X-UA-Compatible" content="IE=edge">
  <meta name="viewport" content="width=device-width, initial-scale=1.0">
  <script src="https://code.jquery.com/jquery-3.6.4.js"></script>
  <title>Chart.js</title>
</head>
<body>
  <h1>円グラフ</h1>
  <canvas id="myPieChart">

  <script src="https://cdn.jsdelivr.net/npm/chart.js@3.0.0/dist/chart.min.js"></script>
+ <script src="https://cdn.jsdelivr.net/npm/chartjs-plugin-datalabels@2.0.0 "></script>
  <script>
    const ctx = document.getElementById("myPieChart");
    const myPieChart = new Chart(ctx, {
      type: 'pie', // 円グラフを使用
      data: {
        labels: ["A型", "O型", "B型", "AB型"],
        datasets: [{
          backgroundColor: [
            "#BB5179",
            "#FAFF67",
            "#58A27C",
            "#3C00FF"
          ],
          data: [38, 31, 21, 10]
        }]
      },
+     plugins: [ChartDataLabels], // pluginとしてchartdatalabelsを追加
      options: {
        }
    });
  </script>
</body>
</html>
3.パーセンテージをラベルに変更
次にパーセンテージを文字に変更するための記述をしていきます。
公式をみてみると
new Chart('id', {
  type: 'bar',
  data: {
    labels: ['foo', 'bar'],
    datasets: [{
      data: [42, 24]
    }]
  },
  options: {
    plugins: {
      datalabels: {
        formatter: function(value, context) {
          return context.chart.data.labels[context.dataIndex];
        }
      }
    }
  }
});
とあるので参考にして追加します。
<!DOCTYPE html>
<html lang="en">
<head>
  <meta charset="UTF-8">
  <meta http-equiv="X-UA-Compatible" content="IE=edge">
  <meta name="viewport" content="width=device-width, initial-scale=1.0">
  <script src="https://code.jquery.com/jquery-3.6.4.js"></script>
  <title>Chart.js</title>
</head>
<body>
  <h1>円グラフ</h1>
  <canvas id="myPieChart">

  <script src="https://cdn.jsdelivr.net/npm/chart.js@3.0.0/dist/chart.min.js"></script>
  <script src="https://cdn.jsdelivr.net/npm/chartjs-plugin-datalabels@2.0.0 "></script>
  <script>
    const ctx = document.getElementById("myPieChart");
    const myPieChart = new Chart(ctx, {
      type: 'pie', // 円グラフを使用
      data: {
        labels: ["A型", "O型", "B型", "AB型"],
        datasets: [{
          backgroundColor: [
            "#BB5179",
            "#FAFF67",
            "#58A27C",
            "#3C00FF"
          ],
          data: [38, 31, 21, 10]
        }]
      },
      plugins: [ChartDataLabels], // pluginとしてchartdatalabelsを追加
      options: {
+       plugins: {
+         datalabels: { // パーセンテージからラベル表記に変更
+           formatter: function(value, context) {
+             return context.chart.data.labels[context.dataIndex];
+           }
+         }
+       }
      }
    });
  </script>
</body>
</html>
4.文字サイズ、色の変更
このままだと文字サイズだったり色が気になるので修正していきます。
こちら修正コードです。
<!DOCTYPE html>
<html lang="en">
<head>
  <meta charset="UTF-8">
  <meta http-equiv="X-UA-Compatible" content="IE=edge">
  <meta name="viewport" content="width=device-width, initial-scale=1.0">
  <script src="https://code.jquery.com/jquery-3.6.4.js"></script>
  <title>Chart.js</title>
</head>
<body>
  <h1>円グラフ</h1>
  <canvas id="myPieChart">

  <script src="https://cdn.jsdelivr.net/npm/chart.js@3.0.0/dist/chart.min.js"></script>
  <script src="https://cdn.jsdelivr.net/npm/chartjs-plugin-datalabels@2.0.0 "></script>
  <script>
    const ctx = document.getElementById("myPieChart");
    const myPieChart = new Chart(ctx, {
      type: 'pie', // 円グラフを使用
      data: {
        labels: ["A型", "O型", "B型", "AB型"],
        datasets: [{
          backgroundColor: [
            "#BB5179",
            "#FAFF67",
            "#58A27C",
            "#3C00FF"
          ],
          data: [38, 31, 21, 10]
        }]
      },
      plugins: [ChartDataLabels], // pluginとしてchartdatalabelsを追加
      options: {
        plugins: {
          datalabels: { // パーセンテージからラベル表記に変更
            formatter: function(value, context) {
              return context.chart.data.labels[context.dataIndex];
            },

+           color:"#000",
+           font: { // フォント設定
+             weight: "bold", // ラベル表記を太字に変更
+             size: 24, // サイズ変更
            }
          }
        }
      }
    });
  </script>
</body>
</html>
5.おわりに
長くなりましたがこれで終わりです。
執筆経緯ですが、chart.jsの記事が思ったとおりに見つからなかったため、執筆いたしました。
chartjs-plugin-labelsといった同じような機能のプラグインもあるので混同しないように注意が必要かと。


