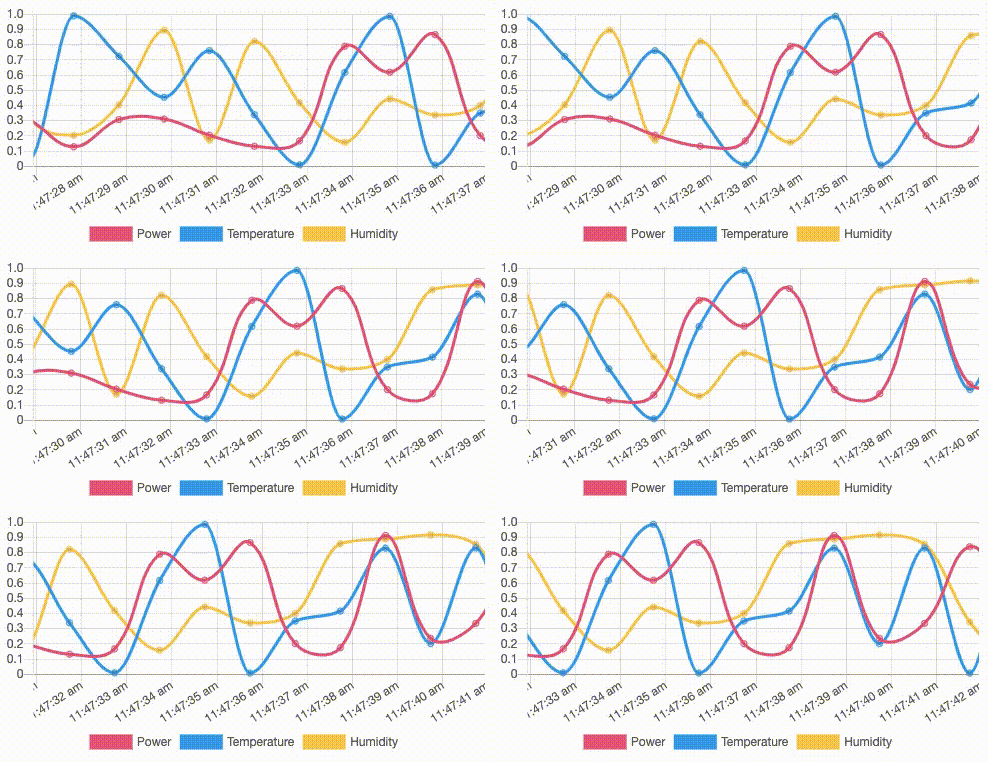
はじめに
リアルタイムストリーミングデータを可視化したくてグラフライブラリを探していたら、結構たくさん出てきた1
Chart.js
今回は、Chart.js でいくことに。理由はこのプラグインがよさげだったから。サイトの説明もわかりやすい
とりあえず動かす
コピペで動くはず
real-time-chart.html
<!DOCTYPE html>
<html lang="en">
<head>
  <script type="text/javascript" src="https://cdnjs.cloudflare.com/ajax/libs/Chart.js/2.9.3/Chart.bundle.js"></script>
  <script type="text/javascript" src="https://cdnjs.cloudflare.com/ajax/libs/moment.js/2.24.0/moment-with-locales.min.js"></script>
  <script src="https://cdn.jsdelivr.net/npm/chartjs-plugin-streaming@latest/dist/chartjs-plugin-streaming.min.js"></script>
</head>

<body>

<canvas id="myChart"></canvas>

<script>
// CHART
var chartColors = {
  red: 'rgb(255, 99, 132)',
  orange: 'rgb(255, 159, 64)',
  yellow: 'rgb(255, 205, 86)',
  green: 'rgb(75, 192, 192)',
  blue: 'rgb(54, 162, 235)',
  purple: 'rgb(153, 102, 255)',
  grey: 'rgb(201, 203, 207)'
};

var ctx = document.getElementById('myChart').getContext('2d');
var chart = new Chart(ctx, {
  type: 'line',
  data: {
    datasets: [{
      label: 'Power',
      borderColor: chartColors.red,
      fill: false,
      data: []
    },
    {
       label: 'Temperature',
       borderColor: chartColors.blue,
       fill: false,
       cubicInterpolationMode: 'monotone',
       data: []
    },
    {
      label: 'Humidity',
      borderColor: chartColors.yellow,
      fill: false,
      cubicInterpolationMode: 'monotone',
      data: []
    }]
  },
  options: {
    legend: {
      position: 'bottom'
    },
    scales: {
      xAxes: [{
        type: 'realtime',
        realtime: {
          delay: 2000,
          onRefresh: function(chart) {
            chart.data.datasets.forEach(function(dataset) {
              dataset.data.push({
                x: Date.now(),
                y: Math.random()
              });
            });
          }
        }
      }]
    }
  }
});
</script>
</body>
</html>
実際の使い方
今回は、実際のデータがこんな感じだったので
{psn: 1, time: "1588382630511", name: "sensor1", amp: 4.97, tem: 6.72, hum: 8.22}
forEach じゃなくて、以下のようにした。dequeue() で配列から上記 JSON データを onRefresh の度に、一つもってくる感じ
        realtime: {
          delay: 3000,
          onRefresh: function(chart) {
            let sensorData = dequeue(); // {psn: 1, time: "1588382630511", name: "sensor1", amp: 4.97, tem: 6.72, hum: 8.22}
            let timeFromSensor = new Date(parseInt(sensorData.time));
            // Power
            chart.data.datasets[0].data.push({
              x: timeFromSensor,
              y: sensorData.amp
            });
            // Temperature
            chart.data.datasets[1].data.push({
              x: timeFromSensor,
              y: sensorData.tem
            });
            // Humidity
            chart.data.datasets[2].data.push({
              x: timeFromSensor,
              y: sensorData.hum
            });
          }
        }
