オープンデータ
自転車シェアリングのオープンデータをWebページで可視化する.OpenStreet株式会社が運営する自転車シェアリングのサービス「HELLO CYCLING」で利用されるステーションや自転車の情報が提供されている.ステーションのデータは,次のJSON形式で与えられる(GBFS: General Bikeshare Feed Specification).latは緯度,lonは経度,nameはステーション名,addressは住所である.
{
    "lat":35.15174,
    "lon":136.91396,
    "name":"ライブリー鶴舞",
    "address":"愛知県名古屋市昭和区鶴舞2丁目14-4-1",
    "station_id":"7405",
    "rental_uris":
    {
        "ios":"https://www.hellocycling.jp/app/port/detail/7405?referrer=odpt",
        "web":"https://www.hellocycling.jp/app/port/detail/7405?referrer=odpt",
        "android":"https://www.hellocycling.jp/app/port/detail/7405?referrer=odpt"
    },
    "parking_hoop":false,
    "parking_type":"street_parking",
    "contact_phone":"+8105038218282",
    "is_charging_station":false,
    "vehicle_type_capacity":
    {
        "num_bikes_now":0,
        "num_bikes_limit":3,
        "num_bikes_parkable":3,
        "num_bikes_rentalable":0
    }
}
開発環境
開発環境としてCodePenを利用する.CodePenはオンラインでHTML,CSS,JavaScriptを利用したWebページ(Penと呼ばれる)の開発が可能である.アカウントがないとPenの保存ができないため,事前にアカウントを取得すること.
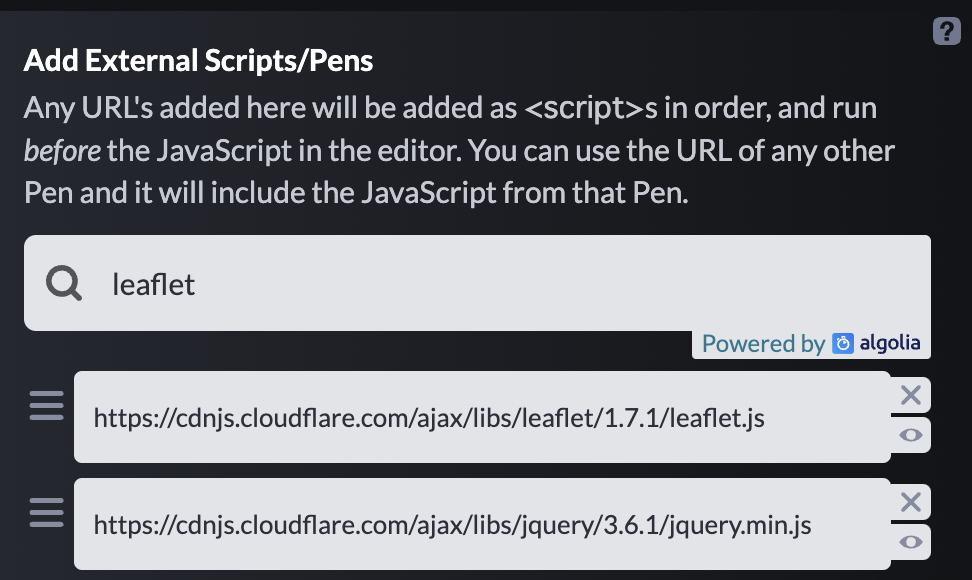
ここでは次のライブラリを利用する.
Penを新規作成し,Settings -> JSでライブラリをCDN(Content Delivery Network)で導入する.
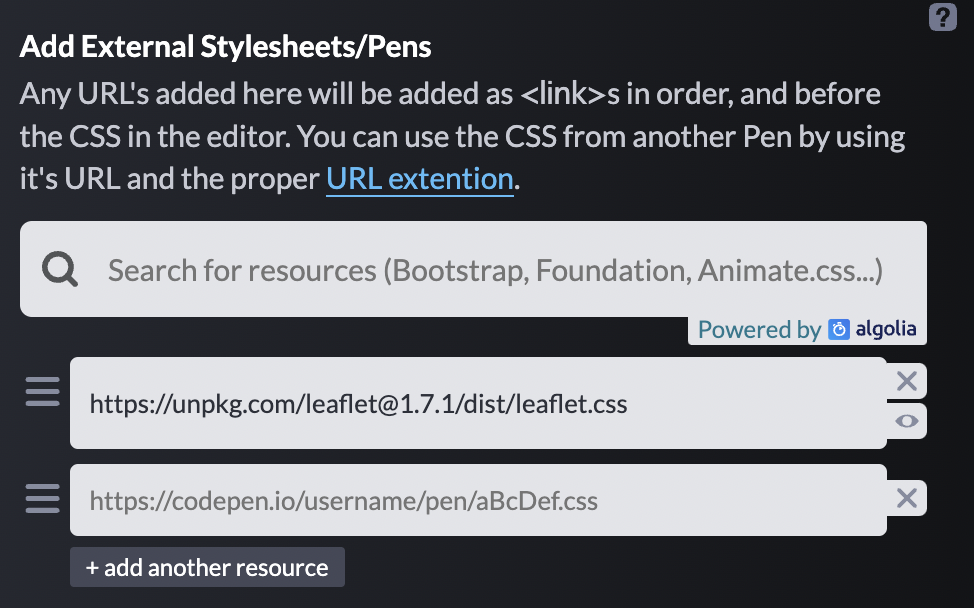
同様にLeafletのCSSをSettings -> CSSから追加する.
https://unpkg.com/leaflet@1.9.3/dist/leaflet.css
ソースコード
HTML
div要素を作成する.id属性にはmapを設定する.
<div id="map"></div>
CSS
地図を全画面表示するための設定を記述する.html要素とbody要素の高さを100%に設定する.id属性がmapの高さを100%に設定する.
html, body{
  height: 100%;
}

#map{
  height: 100%;
}
JavaScript
$.getJSON()で自転車シェアリングのオープンデータを読み込む.住所が愛知県で始まるレコードのみをフィルタし,station_listに追加する.stationの緯度(lat),経度(lon),ステーション名(name)を利用して,マーカー(L.marker)を生成して表示する.
const tile = "https://{s}.tile.openstreetmap.org/{z}/{x}/{y}.png";
const attribution = "© <a href='https://www.openstreetmap.org/copyright'>OpenStreetMap</a> contributors";
const station_url = "https://mukai-lab.info/classes/graduation_preperation_1/station_information.json";
let lat = 35.1706431 ; // 緯度
let lon = 136.8816945; // 経度
let zoom = 14; // ズームレベル
// 地図
let map = L.map("map");
// 緯度・経度・ズームレベルの設定
map.setView([lat, lon], zoom);
// タイルを地図に追加
L.tileLayer(tile,
{
attribution: attribution
}
).addTo(map);
// ステーションのデータ
let station_list = [];
// 対象の住所
let target_address = "愛知県"
// JSONファイルの読込
$.getJSON(station_url, (data) => {
// 対象の住所のステーションのデータを取得
for(let station of data["data"]["stations"]){
let address = station["address"];
if(address.startsWith(target_address)){
station_list.push(station);
console.log(station); // ログの出力
}
}
// ステーションをマーカーとして表示
for(let station of station_list){
let lat = station["lat"];
let lon = station["lon"];
let name = station["name"];
let marker = L.marker([lat, lon]);
marker.bindPopup(`<p>${name}</p>`)
marker.addTo(map);
}
});
デモ
See the Pen ShareCycleMap by Naoto Mukai (@nmukai) on CodePen.