はじめに
今回はpythonのライブラリであるmatplotlibを使用した際にsubplot,subplots,plotなどで詰まったためそれらの違いを話していこうと思います。
1.plt.figure()
一番多く目にするのがこの書き方だと思います。
import numpy as np
import matplotlib.pyplot as plt

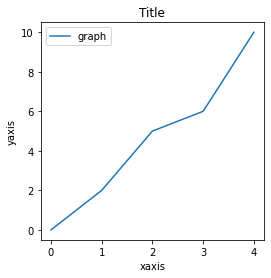
plt.figure(figsize=(4,4))
plt.plot([0,2,5,6], label="graph")
plt.xlabel("x座標")
plt.ylabel("y座標")
plt.legende()
plt.show()
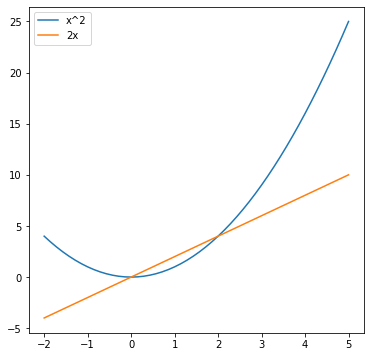
また、グラフを重ねたい場合以下のように書けば重ねることができます。
x = np.linspace(-2,5)
y1 = x ** 2
y2 = 2 * x
plt.figure(figsize=(6,6))
plt.plot(x, y1, label="x^2")
plt.plot(x, y2, label="2x")
plt.legend()
plt.show()
plt.figure() を実行すると描画するエリアの確保ができます。この時figsize=(横の長さ, 縦の長さ)を指定することでどのくらいの大きさのエリアを確保するか指定できます。この確保したエリアに関数などを描画していきます。グラフを追加すると同じエリアに重なるようにして描画されます。では重ねずに描画したい場合はどうすればよいでしょうか
2.plt.subplot()
グラフを重ねずに縦あるいは横に並べて描画したい場合はplt.subplot()を使用します。
x = np.linspace(-np.pi, np.pi)

plt.figure(figsize=(12,4))

plt.subplot(1,3,1) #1×3の要素の内に1番目の要素に配置する
plt.plot(x,np.sin(x), label="sinx")
plt.xlabel("xaxis")
plt.ylabel("yaxis")
plt.title("sin")
plt.legend()

plt.subplot(1,3,2)#1×3の要素の内に2番目の要素に配置する
plt.plot(x,np.cos(x), label="cosx")
plt.xlabel("xaxis")
plt.ylabel("yaxis")
plt.title("sin")
plt.legend()

plt.subplot(1,3,3)#1×3の要素の内に3番目の要素に配置する
plt.plot(x,np.tan(x), label="tanx")
plt.xlabel("xaxis")
plt.ylabel("yaxis")
plt.title("sin")
plt.legend()
plt.tight_layout()
plt.figure(figsize=(12,4))で12×4のエリアを確保します。plt.subplot(1,3,1)で12×4のエリアを横に3等分したもののうち左から1番目のエリアに描画します。つまりplt.subplot()は確保したエリアをいくつかの要素に分割し、その要素の何番目に記述するかを指定することができます。しかしこの書き方では毎回タイトルやxラベルなどの要素を指定しなければならないため少し面倒です。最後のplt.tight_layout()はグラフ同士が重ならないようにするために追加しています。また、以下のような書き方でもできます。
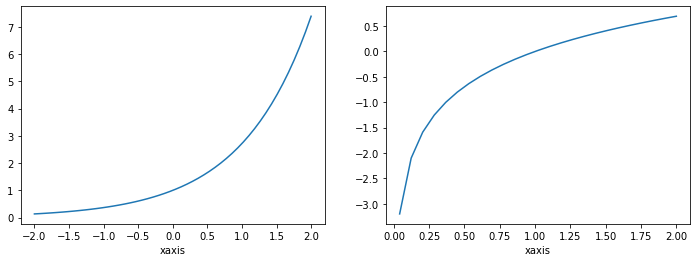
x = np.linspace(-2,2)
y_exp = np.exp(x)
y_log = np.log(x)

fig = plt.figure(figsize=(12,4))
ax1 = fig.add_subplot(1,2,1)
ax1.plot(x,y_exp)
ax1.set_xlabel("xaxis")

ax2 = fig.add_subplot(1,2,2)
ax2.plot(x,y_log)
ax2.set_xlabel("xaxis")
3.plt.subplots()
この方法では以上のような書き方で問題となった煩雑さを解決してくれます。
x = np.linspace(-2,2)
y1 = np.sin(np.exp(x))
y2 = np.exp(np.sin(x))
y3 = np.sin(np.cos(x))

fig, ax = plt.subplots(1, 3, figsize=(14,3))
ax[0].plot(x,y1)
ax[1].plot(x,y2)
ax[2].plot(x,y3)

for i in range(3):
  ax[i].set_xlabel("x axis")
  ax[i].set_ylabel("y axis")
plt.tight_layout()

plt.subplots() で描画するエリアの確保とそのエリアを何分割するかを一度に指定することができます。以上のような書き方をすることですっきりとしたコードでグラフを確保することができます。
終わりに
今までmatplolibはデータ分析において非常に活躍するのでしっかりと使えるようにしておきましょう!よきデータ分析ライフを!


