install
pip install pyMaxflow
グラフの作り方
sample.py
# グラフの定義
g=maxflow.Graph[int]() # or g=maxflow.Graph[float]()
# ノードを格子状に追加
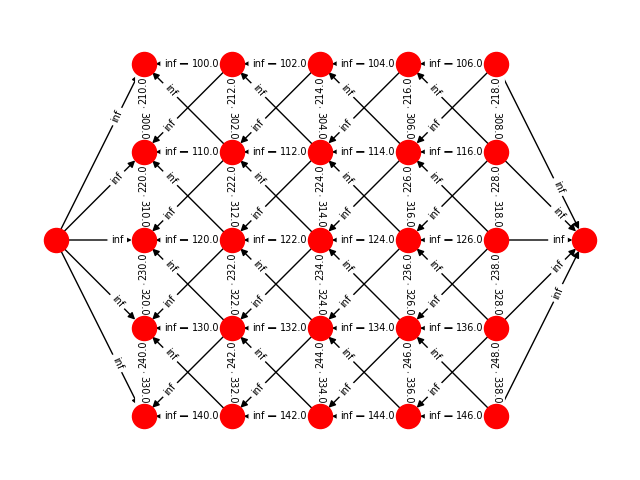
nodeids = g.add_grid_nodes((5, 5))

structure = np.array([[np.inf, 0, 0],
                      [np.inf, 0, 0],
                      [np.inf, 0, 0]
                      ])
# edgeをstructure指定した構造に
g.add_grid_edges(nodeids, structure=structure, symmetric=False)
# weight edgeの重みを定義
weights = np.array([[100, 110, 120, 130, 140]]).T + np.array([0, 2, 4, 6, 8])
# edgeを伸ばす方向を決める
structure = np.zeros((3, 3))
structure[1, 2] = 1
# structureで指定した方向にweightの重みでedgeを伸ばす
g.add_grid_edges(nodeids, structure=structure, weights=weights, symmetric=False)

structure = np.zeros((3, 3))
structure[0, 1] = 1
g.add_grid_edges(nodeids, structure=structure, weights=weights + 100, symmetric=False)

structure = np.zeros((3, 3))
structure[2, 1] = 1
g.add_grid_edges(nodeids, structure=structure, weights=weights + 200, symmetric=False)

left = nodeids[:, 0]
# sからleftで指定したノードに
g.add_grid_tedges(left, np.inf, 0)
right = nodeids[:, -1]

g.add_grid_tedges(right, 0, np.inf)
可視化
view.py
def plot_graph(nxgraph):
    X, Y = np.mgrid[:5, :5]
    aux = np.array([Y.ravel(), X[::-1].ravel()]).T
    positions = {i: aux[i] for i in range(25)}
    positions['s'] = (-1, 2)
    positions['t'] = (5, 2)

    # nxgraph.remove_nodes_from(['s', 't'])
    edge_labels = {}
    for u, v, d in nxgraph.edges(data=True):
        edge_labels[(u, v)] = d['weight']
    plt.clf()
    nx.draw(nxgraph, pos=positions)
    nx.draw_networkx_edge_labels(nxgraph, pos=positions, edge_labels=edge_labels, label_pos=0.3, font_size=7)
    plt.axis('equal')
    plt.show()


nxg = g.get_nx_graph()
plot_graph(nxg)
詳しくは動作させながらだと分かりやすいです。
