はじめに
少し前の情報ですが、株式会社ラック社からDNSプロトコルを使用したウィルスについての注意喚起がありました。
■遠隔操作ウイルスの制御にDNSプロトコルを使用する事案への注意喚起
http://www.lac.co.jp/security/alert/2016/02/01_alert_01.html
記事中にそのウィルスへの対応法について記載があり、その1つに「内部DNSのアクセスログから不正なリクエストを発見する(ログを取得する)」があげられています。
本事案以外でも、多くのマルウェアは名前解決を行いC&Cサーバとやり取りを行うため、DNS通信のログを取得することは、調査において重要な情報になると考えます。
DNS通信のログを取得するといっても、単純なパケットキャプチャだと、閲覧しにくい(後で情報を追う時に時間が掛かる)等の問題があります。
今回は、以下のオープン・ソースプロダクトを使用して、閲覧がしやすい仕組みを作ってみたいと思います。
- Packetbeat
- Elasticsearch
- Kibana
プロダクト説明
"Packetbeat"は、elastic社が提供しているパケットモニタリングツールです。
「Beats」というプロダクト郡の1つで、"Packetbeat"の他に"Filebeat"、"Metricbeat"、"Topbeat"、"Winlogbeat"があります。
"Elasticsearch"、"Kibana"もelastic社のプロダクトで、"Elasticsearch"は全文検索エンジン、"Kibana"はログ可視化ツールです。
https://www.elastic.co/products/elasticsearch
https://www.elastic.co/products/kibana
構成
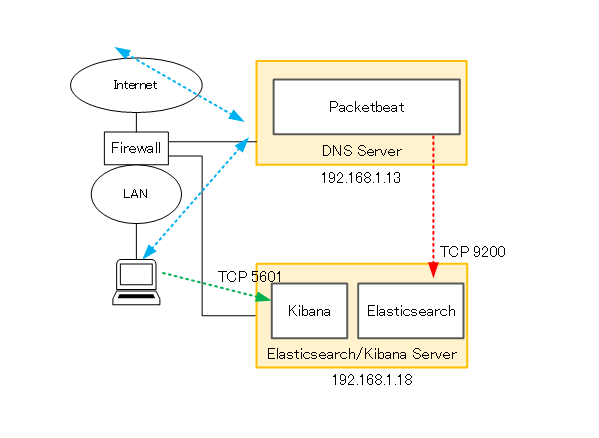
青い矢印:DNSクエリ、応答通信
赤い矢印:PacketbeatからElasticsearchへのログ転送通信
緑の矢印:クライアントPCからKibana(WebUI)へのアクセス通信
●DNS Server
CentOS 7.2
Packetbeat 1.2.3
●Elasticsearch/Kibana Server
CentOS 7.2
Elasticsearch 2.3.5
Kibana 2.5.4
今回検証はしていませんが、スイッチでミラーポートを設定し、Packetbeat Serverへパケットを流してあげれば、上の構成と同じくDNS通信の可視化が可能なはずです。DNSサーバの負荷を考えるとこの構成のほうが現実的ですね。 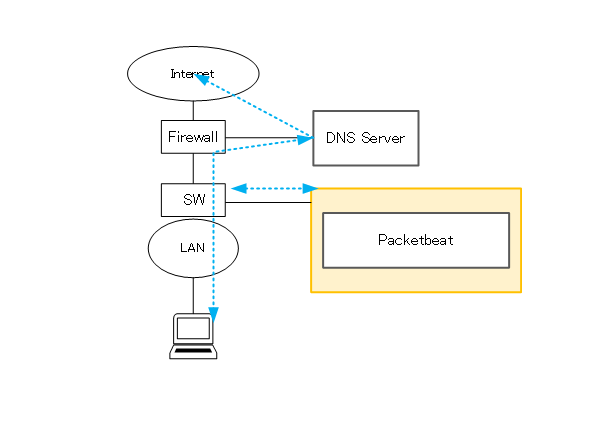
インストール
・ 今回はインストールして動作させることを目的としているため、細かなパラメータの調整は割愛しています。
・ Firewalldは停止させている想定です。(systemctl stop firewalld)
Packetbeat
"DNS Server"で以下のコマンドを実行します。
sudo yum install libpcap
curl -L -O https://download.elastic.co/beats/packetbeat/packetbeat-1.2.3-x86_64.rpm
sudo rpm -vi packetbeat-1.2.3-x86_64.rpm
インストール完了後、以下の設定ファイルを編集します。
/etc/packetbeat/packetbeat.yml
Protocolsセクションで、” ports: [53]”がコメントアウトされていないことを確認します。
今回はDNS以外のログは取得しないので、その他のポート番号行はコメントアウトします。
※ports: [80, 8080, 8000, 5000, 8002]等
<略>
############################# Protocols #######################################
protocols:
  dns:
    # Configure the ports where to listen for DNS traffic. You can disable
    # the DNS protocol by commenting out the list of ports.
    ports: [53]
<略>
  http:
    # Configure the ports where to listen for HTTP traffic. You can disable
    # the HTTP protocol by commenting out the list of ports.
    #ports: [80, 8080, 8000, 5000, 8002]
<略>
  memcache:
    # Configure the ports where to listen for memcache traffic. You can disable
    # the Memcache protocol by commenting out the list of ports.
    #ports: [11211]
<略>
  mysql:
    # Configure the ports where to listen for MySQL traffic. You can disable
    # the MySQL protocol by commenting out the list of ports.
    #ports: [3306]

  pgsql:
    # Configure the ports where to listen for Pgsql traffic. You can disable
    # the Pgsql protocol by commenting out the list of ports.
    #ports: [5432]

  redis:
    # Configure the ports where to listen for Redis traffic. You can disable
    # the Redis protocol by commenting out the list of ports.
    #ports: [6379]

  thrift:
    # Configure the ports where to listen for Thrift-RPC traffic. You can disable
    # the Thrift-RPC protocol by commenting out the list of ports.
    #ports: [9090]

  mongodb:
    # Configure the ports where to listen for MongoDB traffic. You can disable
    # the MongoDB protocol by commenting out the list of ports.
    #ports: [27017]
次に、Outputセクションで情報送信先(Elasticsearch)の設定を行います。
送信先として、Elasticsearch/Kibana ServerのIPアドレスを記載します。
<略>
############################# Output ##########################################

# Configure what outputs to use when sending the data collected by the beat.
# Multiple outputs may be used.
output:

  ### Elasticsearch as output
  elasticsearch:
    # Array of hosts to connect to.
    # Scheme and port can be left out and will be set to the default (http and 9200)
    # In case you specify and additional path, the scheme is required: http://localhost:9200/path
    # IPv6 addresses should always be defined as: https://[2001:db8::1]:9200
    #hosts: ["localhost:9200"]
    hosts: ["192.168.1.18:9200"]

<略>
設定完了後、"Packetbeat"を起動します。
sudo systemctl start packetbeat
Elasticsearch
"Elasticsearch/Kibana Server"で以下のコマンドを実行します。
sudo yum install -y java
sudo cat <<EOF> /etc/yum.repos.d/elasticsearch.repo
[elasticsearch-2.x]
name=Elasticsearch repository for 2.x packages
baseurl=http://packages.elastic.co/elasticsearch/2.x/centos
gpgcheck=1
gpgkey=http://packages.elastic.co/GPG-KEY-elasticsearch
enabled=1
EOF
sudo yum install elasticsearch-2.3.5
インストール完了後、以下の設定ファイルを編集します。
/etc/elasticsearch/elasticsearch.yml
Networkセクションで、”network.host”に"Elasticsearch/Kibana Server"のIPアドレスを記載します。
<略>
# ---------------------------------- Network -----------------------------------
#
# Set the bind address to a specific IP (IPv4 or IPv6):
#
network.host: 192.168.1.18
#
# Set a custom port for HTTP:
#
# http.port: 9200
#
# For more information, see the documentation at:
# <http://www.elastic.co/guide/en/elasticsearch/reference/current/modules-network.html>
<略>
設定完了後、"Elasticsearch"を起動します。
sudo systemctl start elasticsearch
Kibana
"Elasticsearch/Kibana Server"で以下のコマンドを実行します。
sudo cat <<EOF> /etc/yum.repos.d/kibana.repo
[kibana-4.5]
name=Kibana repository for 4.5.x packages
baseurl=http://packages.elastic.co/kibana/4.5/centos
gpgcheck=1
gpgkey=http://packages.elastic.co/GPG-KEY-elasticsearch
enabled=1
EOF
sudo yum install kibana-4.5.4
インストール完了後、以下の設定ファイルを編集します。
/opt/kibana/config/kibana.yml
"elasticsearch.url"に"Elasticsearch/Kibana Server"のIPアドレスを記載します。
<略>
# The Elasticsearch instance to use for all your queries.
elasticsearch.url: "http://192.168.1.18:9200"

# preserve_elasticsearch_host true will send the hostname specified in `elasticsearch`. If you set it to false,
# then the host you use to connect to *this* Kibana instance will be sent.
# elasticsearch.preserveHost: true
<略>
設定完了後、"Kibana"を起動します。
sudo systemctl start kibana
Elasticsearchテンプレートの定義
Elasticsearchで、Packetbeatで取得した情報を扱うためにテンプレートを定義します。
"DNS Server"で以下のコマンドを実行します。
curl -XPUT 'http://192.168.1.18:9200/_template/packetbeat' -d@/etc/packetbeat/packetbeat.template.json

{"acknowledged":true}
コマンド実行結果が”{"acknowledged":true}”となることを確認します。
Kibanaダッシュボードの定義
Kibanaでログ可視化に使用するダッシュボードを定義します。
"Elasticsearch/Kibana Server"で以下のコマンドを実行します。
※Elastic社が用意しているダッシュボードをインストールします
curl -L -O http://download.elastic.co/beats/dashboards/beats-dashboards-1.2.3.zip
unzip beats-dashboards-1.2.3.zip
cd beats-dashboards-1.2.3/
./load.sh
※Packetbeat以外のBeatsシリーズのダッシュボードもインストールされます
Kibanaへアクセス
Kibanaにアクセスします。
http://192.168.1.18:5601/
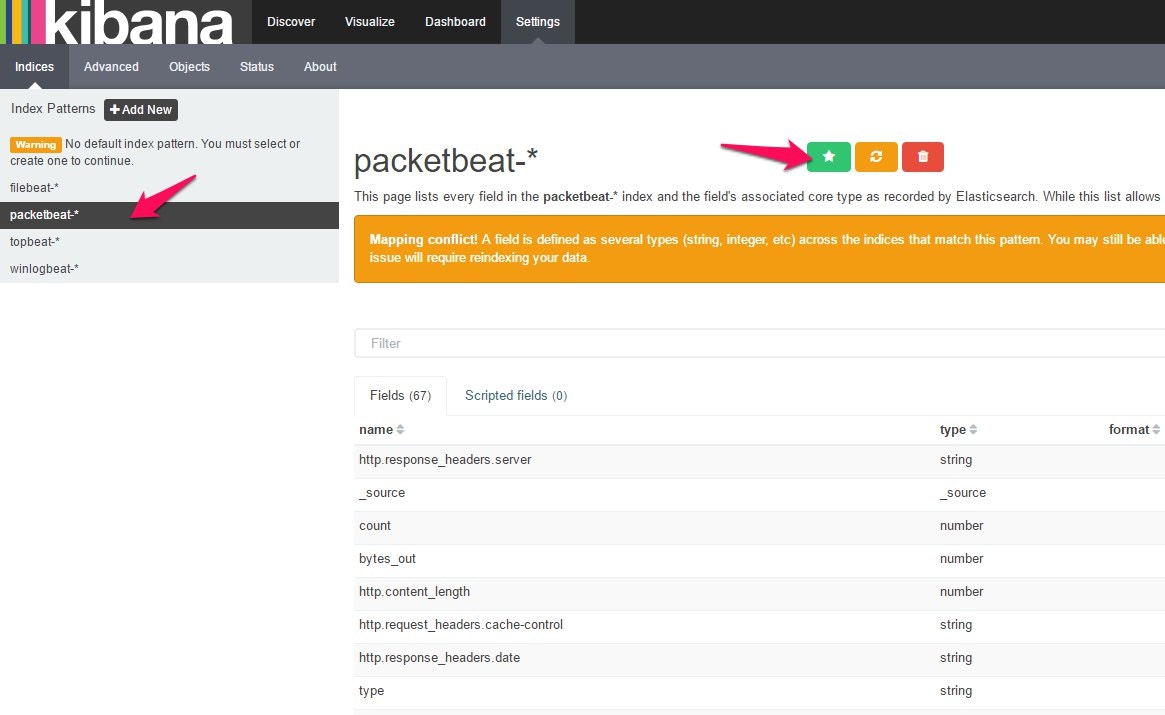
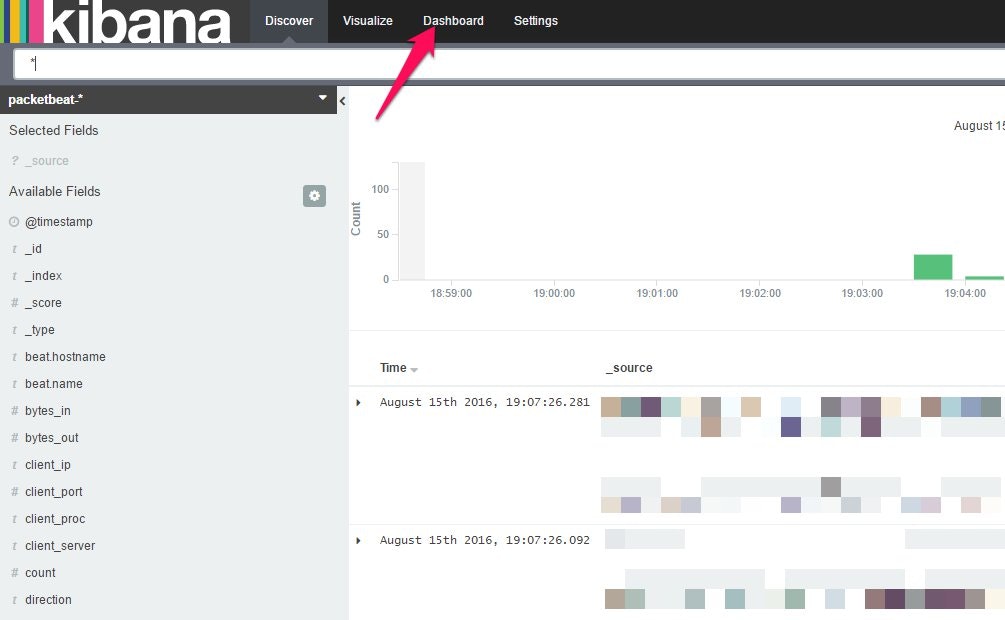
以下の画面が表示されるので、左メニューから"packetbeat-*"を選択し、右メニューに表示される画面でスターアイコンをクリックします。
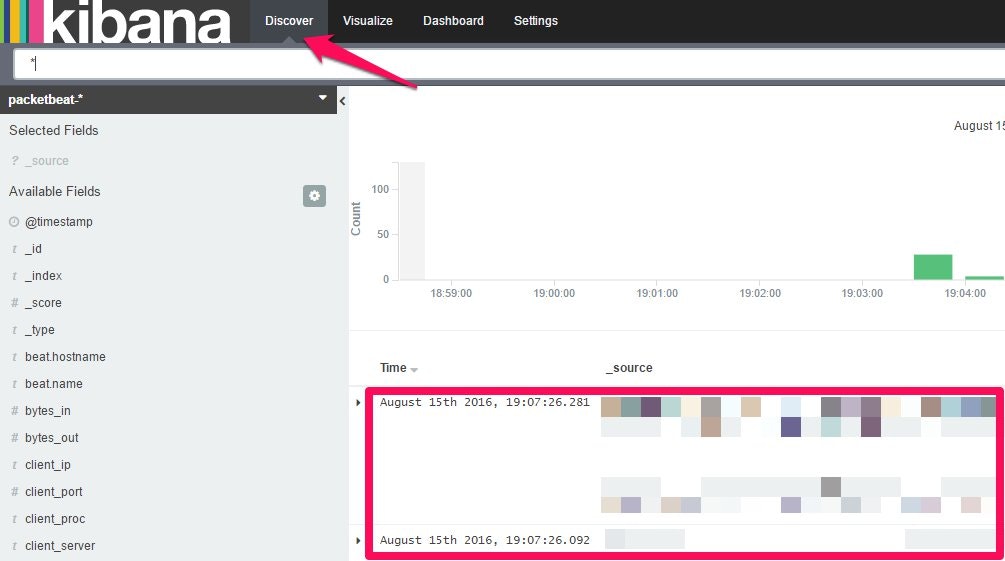
上メニューの"Discover"をクリックし、"DNS Server"からのログを受信、格納できていることを確認します。
受信できていない場合は、"DNS Server"がDNSクエリを受信できているか、”Packetbeat”から"Elasticsearch/Kibana Server"にログが転送されているか等を確認して下さい。
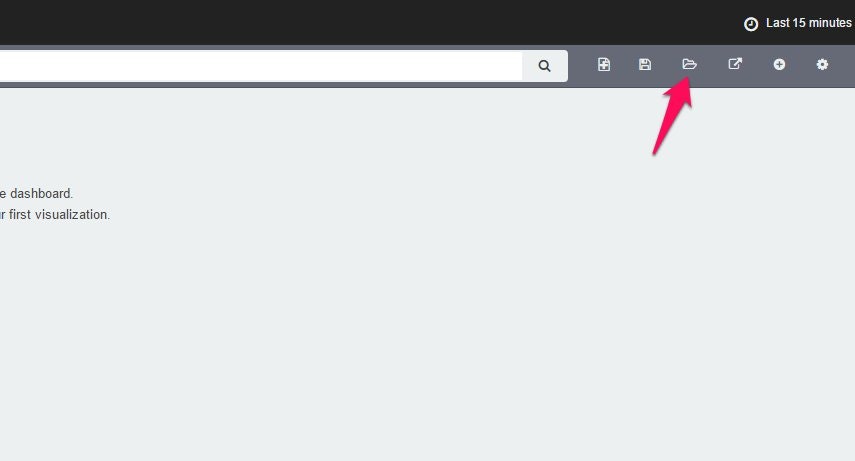
次に、上メニューの"Dashbord"をクリックし、表示された画面の右上にあるフォルダアイコンをクリックします。
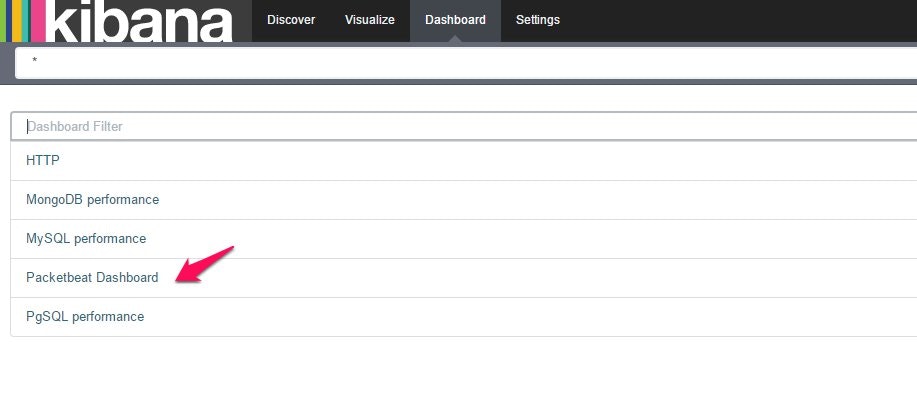
Dashbordの選択メニューが表示されるので、”Packetbeat Dashboard”をクリックします。
”Packetbeat Dashboard”が表示されます。
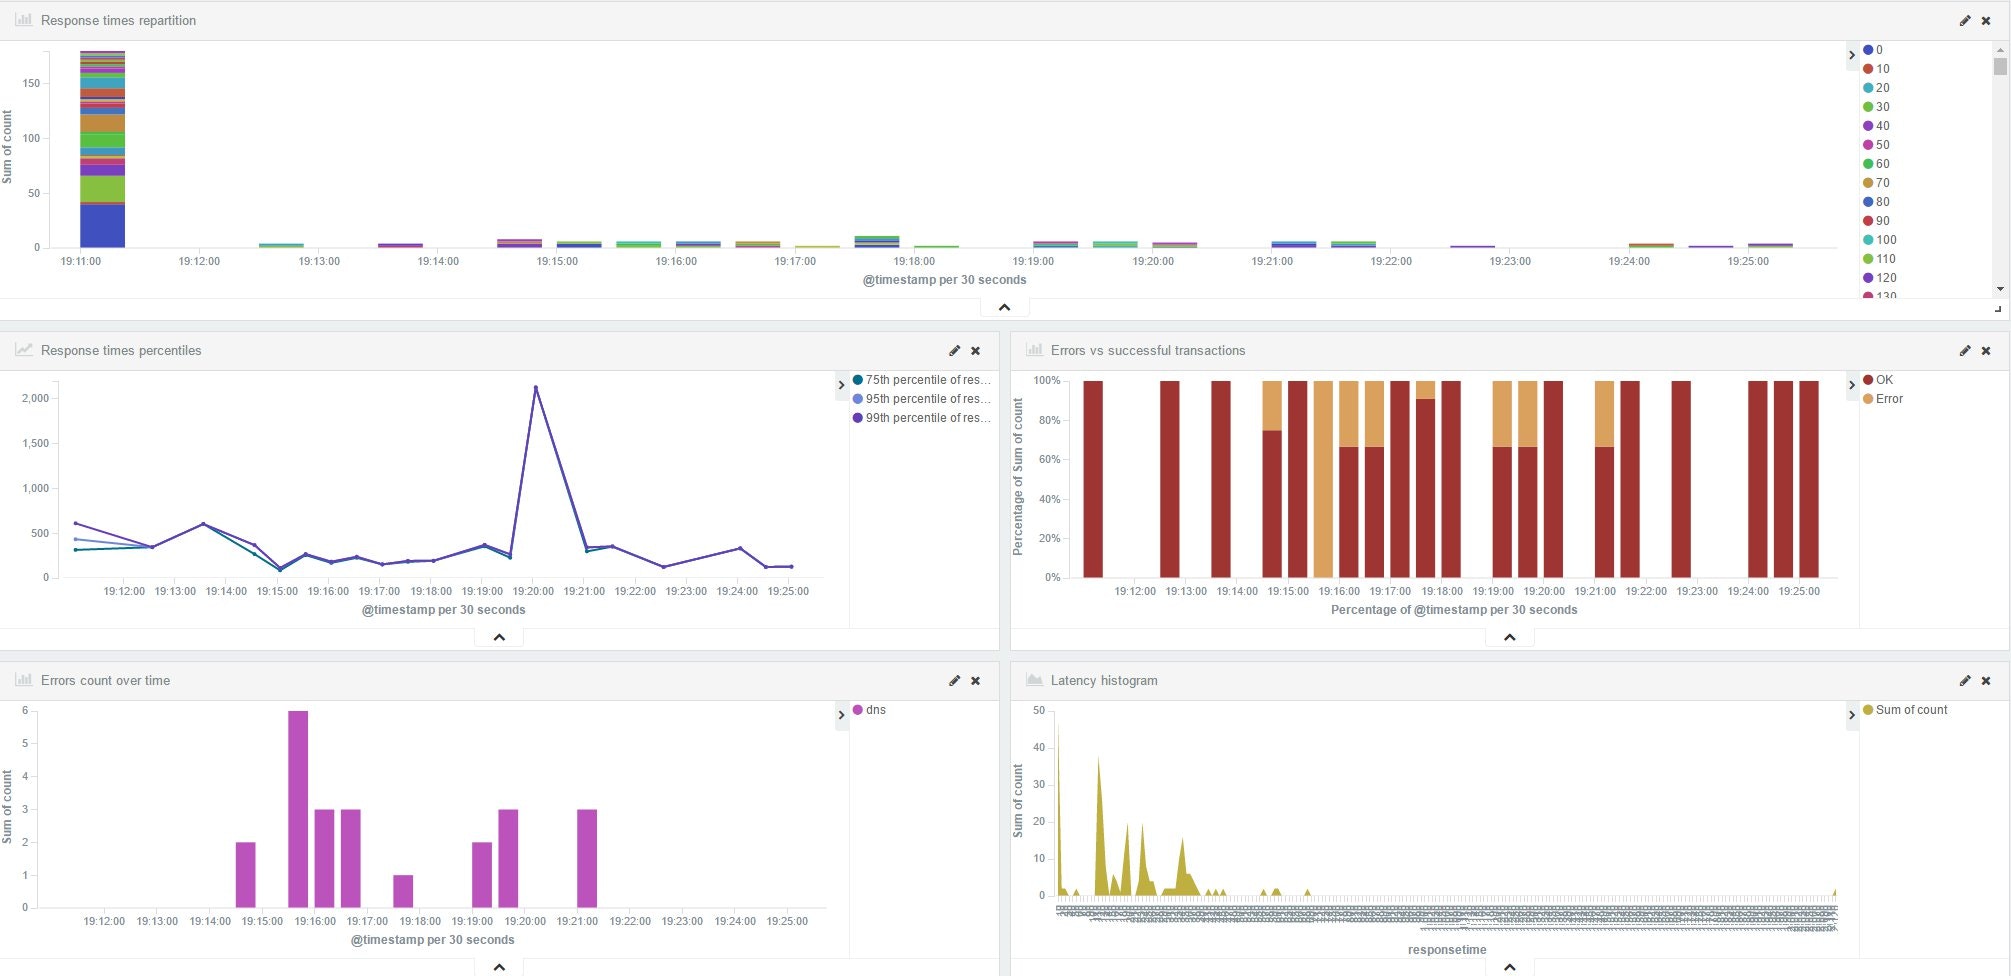
DNS専用のダッシュボードを作る
”Packetbeat Dashboard”はDNS専用のダッシュボードではないため、専用のダッシュボードを作成します。
※続きは次回の記事で書きたいと思います。