こんにちは。
未来検索ブラジルの菅藤です。
今日は何番煎じかわからないけど時系列データの予測について書いてみたいと思います。
1. はじめに
時系列データの予測って基本的にそんなに使えないイメージがあるのですが、どれほどのものか、実践で使えそうかなどをみていきたいと思います。
具体的にやってみたのは以下の通り
Twitterのフォロワー数を日々取得する
あの渋い APIで頑張る
自分のTwitterのフォロワー数の予測を立ててみる
(1) SARIMA modelで予測
・[Combining neural network model with seasonal time series ARIMA model]
https://www.sciencedirect.com/science/article/pii/S004016250000113X
・[SARIMAで時系列データの分析(PV数の予測)]
https://www.kumilog.net/entry/sarima-pv @xkumiyu
(2)Prophet modelで予測
・[Prophet公式]
https://facebook.github.io/prophet/docs/quick_start.html
・[時系列解析ライブラリProphet 公式ドキュメント翻訳1(概要&特徴編)]
https://qiita.com/japanesebonobo/items/96868e58d4da42d36807 @japanesebonobo
今回の内容
ツイートもせず、日々減っていくフォロワー数の予測は僕の心をさらに抉ってくれる。
先に結論を言うと、フォロワー数は減るし、増える目処は立たない。
2. 環境
- マシン
- Mac --version 10.15.1
- Python
- Python3 --version 3.7.0
3.下準備
日々のフォロワー数のデータはこんな感じ。
見るに耐えない。(https://twitter.com/Ndtn_/)
http://web.sfc.wide.ad.jp/~nadechin/follower.csv
date        follower
2018/9/6	39.569
2018/9/7	39.57
2018/9/8	39.573
   .           .
   .           .
   .           .
2019/12/10	37.861
4. 時系列データの処理
学習データとテストデータを分ける。
pandasでもnumpyでも何でも良いがひとまず用意するのは、
・2018/09/06 ~ 2019/12/10 の元データ
・2018/09/06 ~ 2019/11/30 の学習データ
・2019/12/01 ~ 2019/12/10 のテストデータ
ADF検定でデータの定常性の確認をする。
・[statsmodels.tsa.stattools.adfuller]
http://www.statsmodels.org/dev/generated/statsmodels.tsa.stattools.adfuller.html
・[帰無仮説, 有意水準]
http://www.gen-info.osaka-u.ac.jp/MEPHAS/express/express11.html
出力結果は以下の通り
⇨p-value > 0.05
したがって定常性を持つとはいえない。
定常性を持たせるために、差分を取り季節性を取り除く。
data = [Scatter(x=df.index, y=df.follower.diff())]
続いて季節性の除去。
data = [Scatter(x=df.index, y=df.follower-res.seasonal)]
これで再びADF検定を行う。
⇨p-value < 0.05
結果、定常性を持つ時系列データへと処理を行うことができた。
5. 時系列データの予測
SARIMA modelの場合、各々のデータのモデルの作成は
# coding:utf-8
from statsmodels.tsa.statespace.sarimax import SARIMAX

model = SARIMAX(
    train,
    order=(p, d, q),
    seasonal_order=(sa, sd, sq, s),
    enforce_stationarity=False,
    enforce_invertibility=False)
result = model.fit()
で行う。
order=(p, d, q)はARIMAモデルのパラメーター
seasonal_order=(sp, sd, sq, s)は季節性のパラメーター
参照↓
・[statsmodels.tsa.statespace.sarimax.SARIMAX]
https://www.statsmodels.org/dev/generated/statsmodels.tsa.statespace.sarimax.SARIMAX.html
・[SARIMAで時系列データの分析(PV数の予測)]
https://www.kumilog.net/entry/sarima-pv @xkumiyu
次にProphet modelの作成を行う。
Prophetはひとまず学習データを打ち込めばよしなにモデルを構築してくれるという、
「何やってるか分からないけど予測らしい何かが出来た」を実現してくれる。
今日から俺も2秒のコピペでデータサイエンティストになれる。
# coding:utf-8
import pandad as pd
import numpy as np
from fbprophet import Prophet

data = pd.read_csv('follower.csv')
data.follower= data.follower.apply(lambda x: int(x.replace(',', '')))
# カラム名は'ds','y'に設定しなくてはならない
data = data.rename(columns={'date': 'ds', 'follower': 'y'})
model = Prophet()
model.fit(data)
6. 時系列データの予測
・SARIMA model
SARIMA modelに掛けたテストデータの予測
2019-12-01  38002.878685
2019-12-02  38001.204647
2019-12-03  37998.080676
2019-12-04  37988.324131
2019-12-05  37981.134367
2019-12-06  37974.569498
2019-12-07  37966.333432
2019-12-08  37958.270232
2019-12-09  37956.258566
2019-12-10  37952.875398
・Prophet model
Prophet modelに掛けたテストデータの予測
2019-12-01  37958.337506
2019-12-02  37959.963661
2019-12-03  37957.304699
2019-12-04  37943.272430
2019-12-05  37934.533210
2019-12-06  37920.537811
2019-12-07  37908.529618
2019-12-08  37905.819057
2019-12-09  37907.445213
2019-12-10  37904.786251
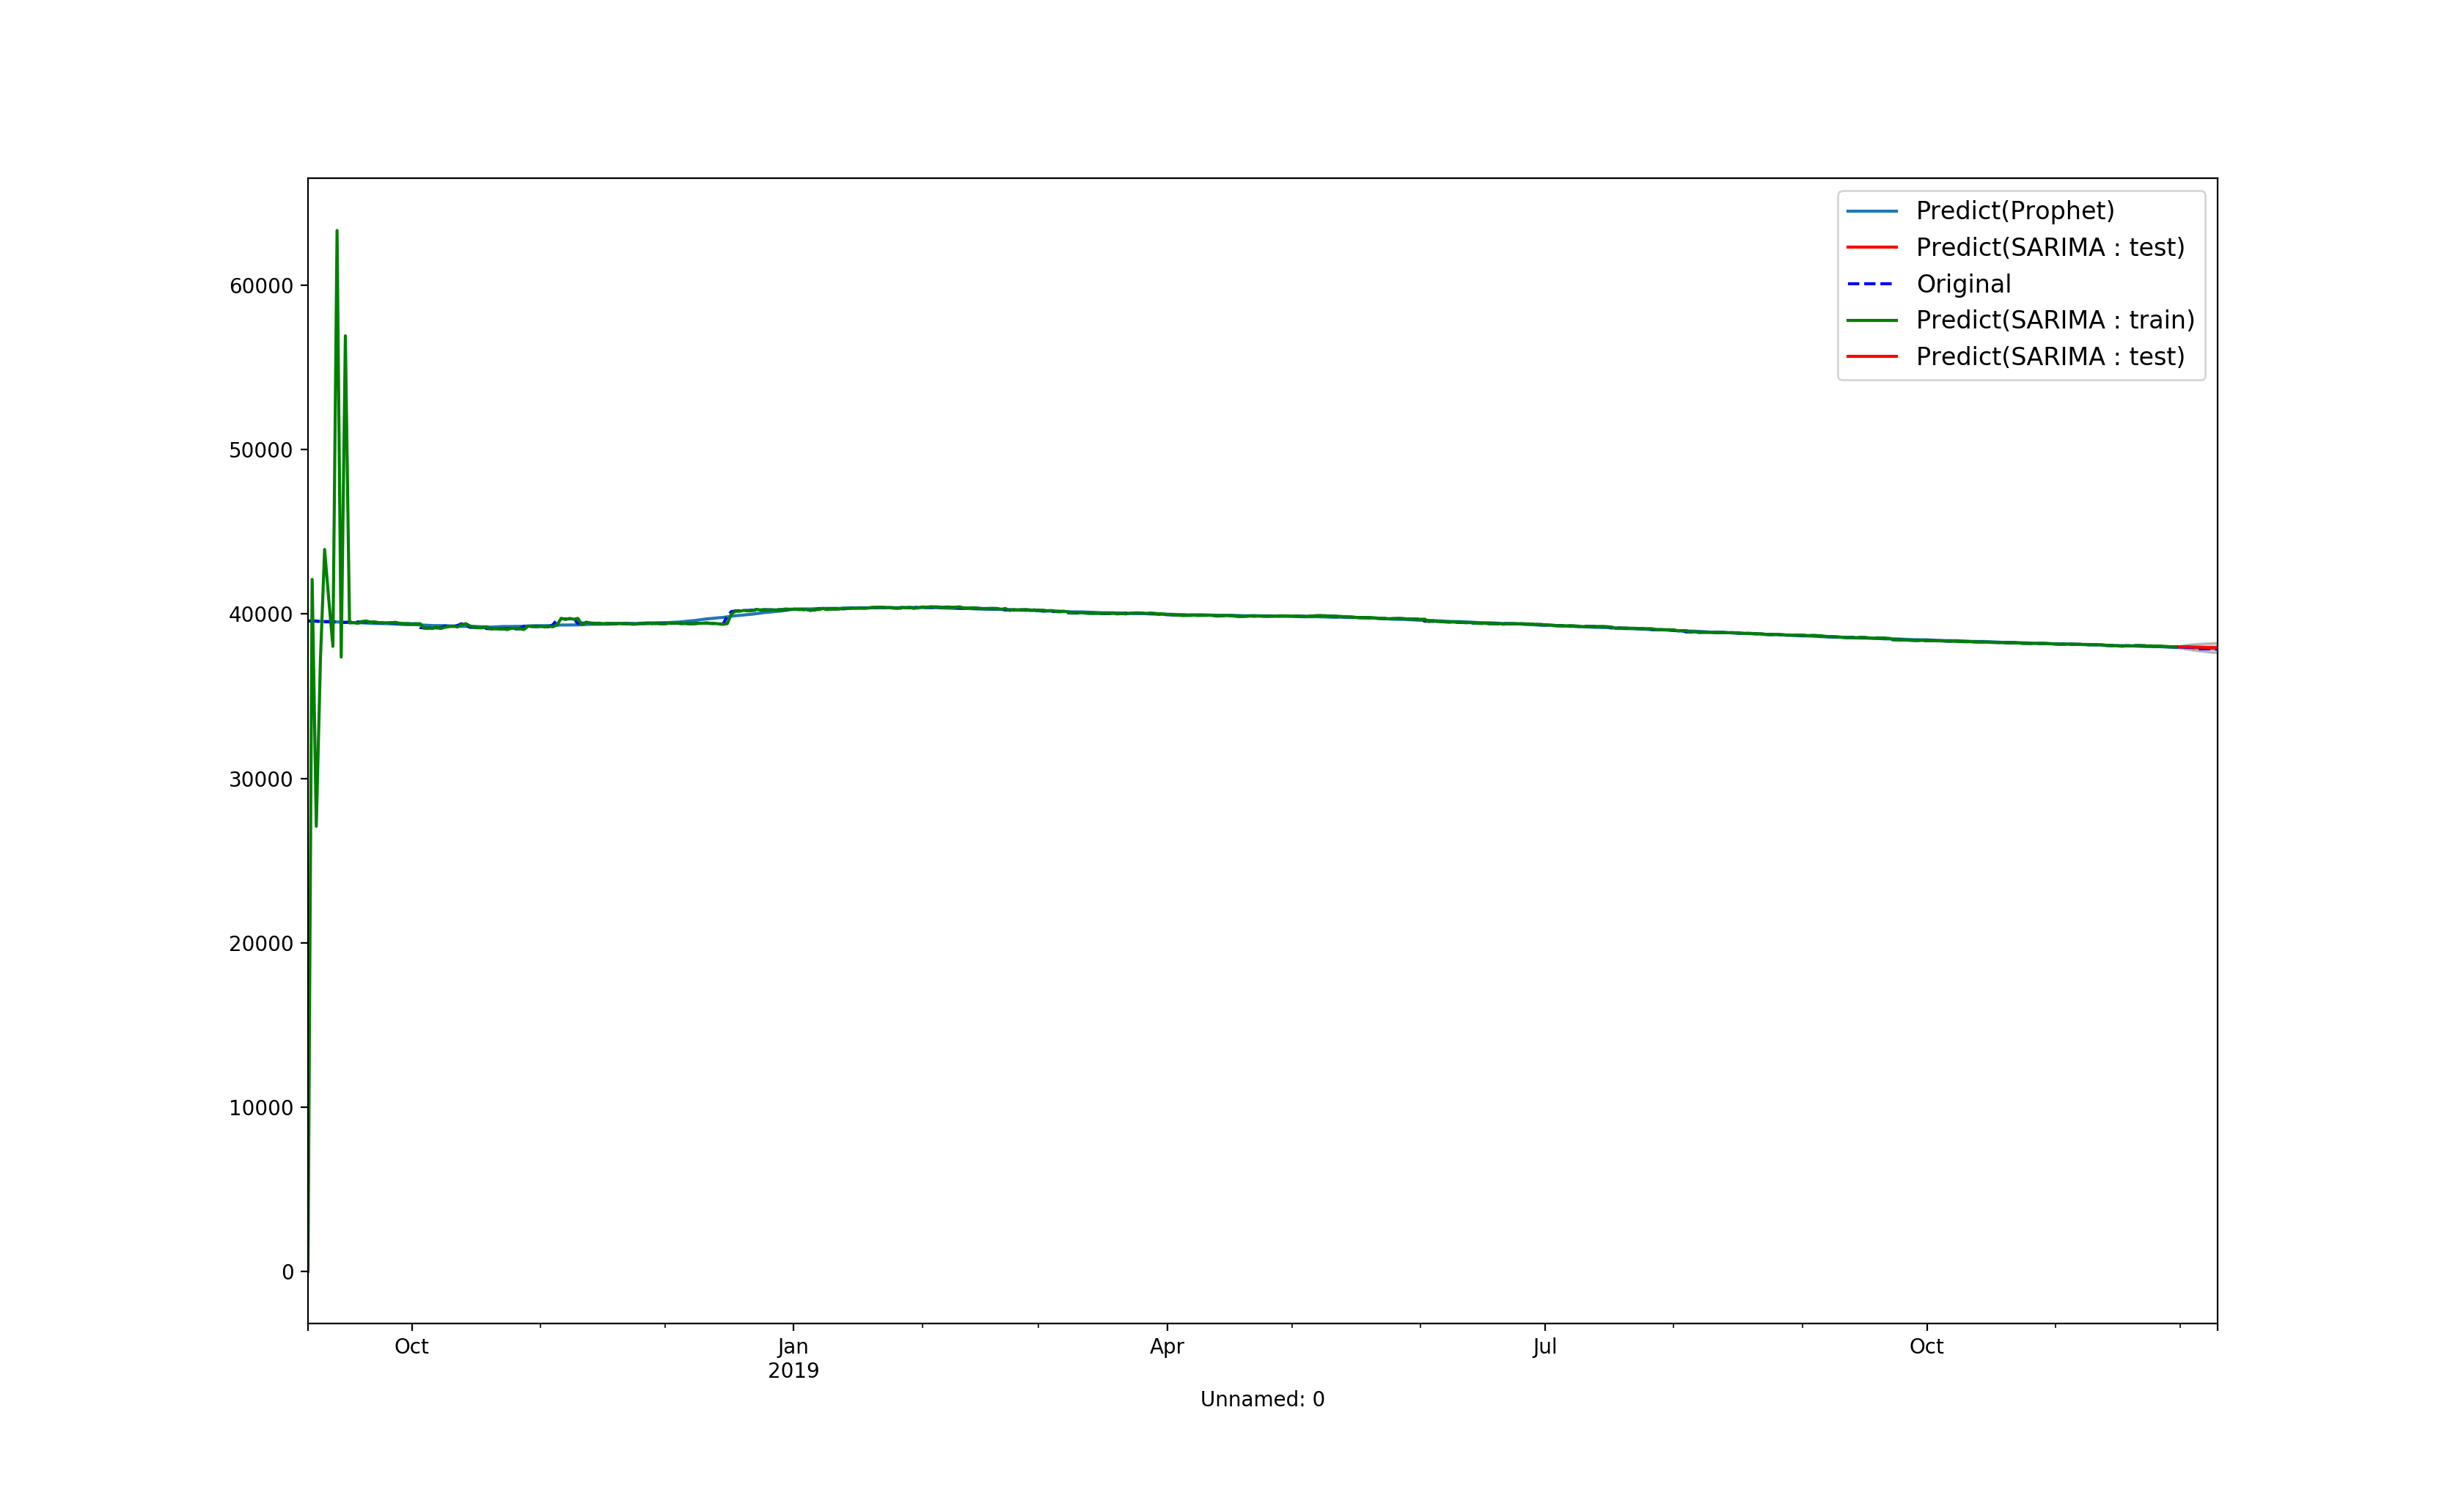
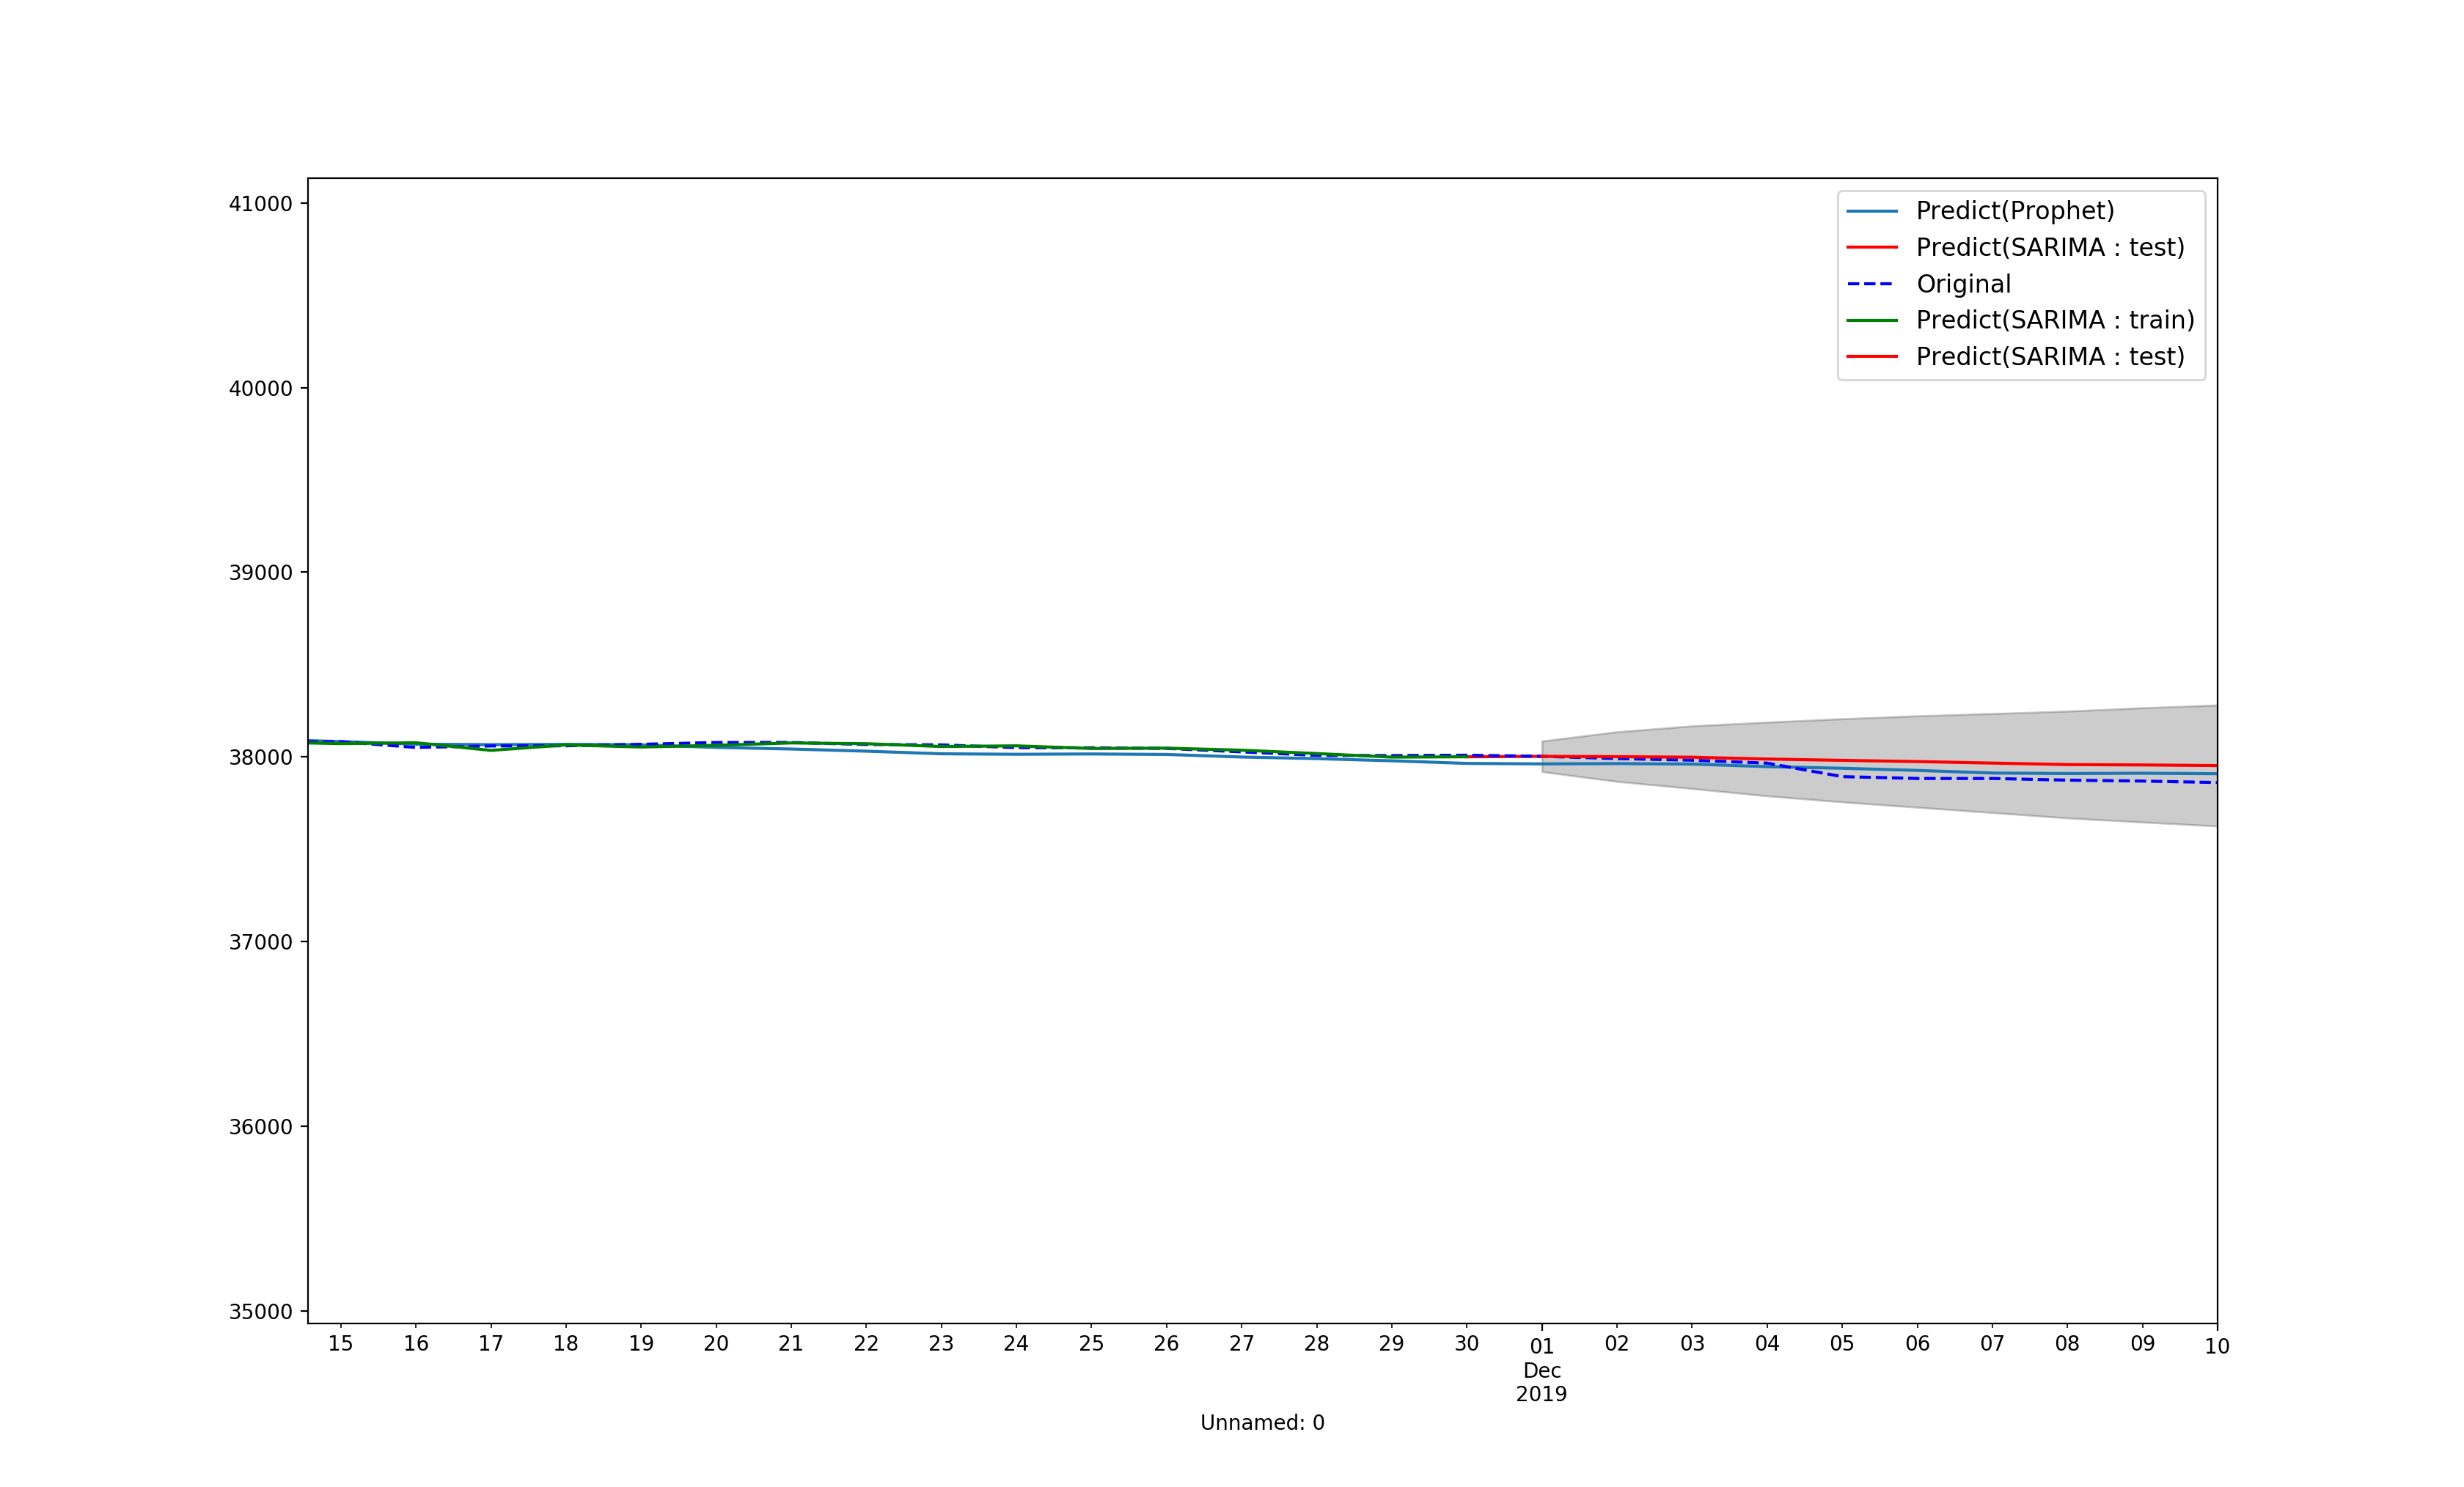
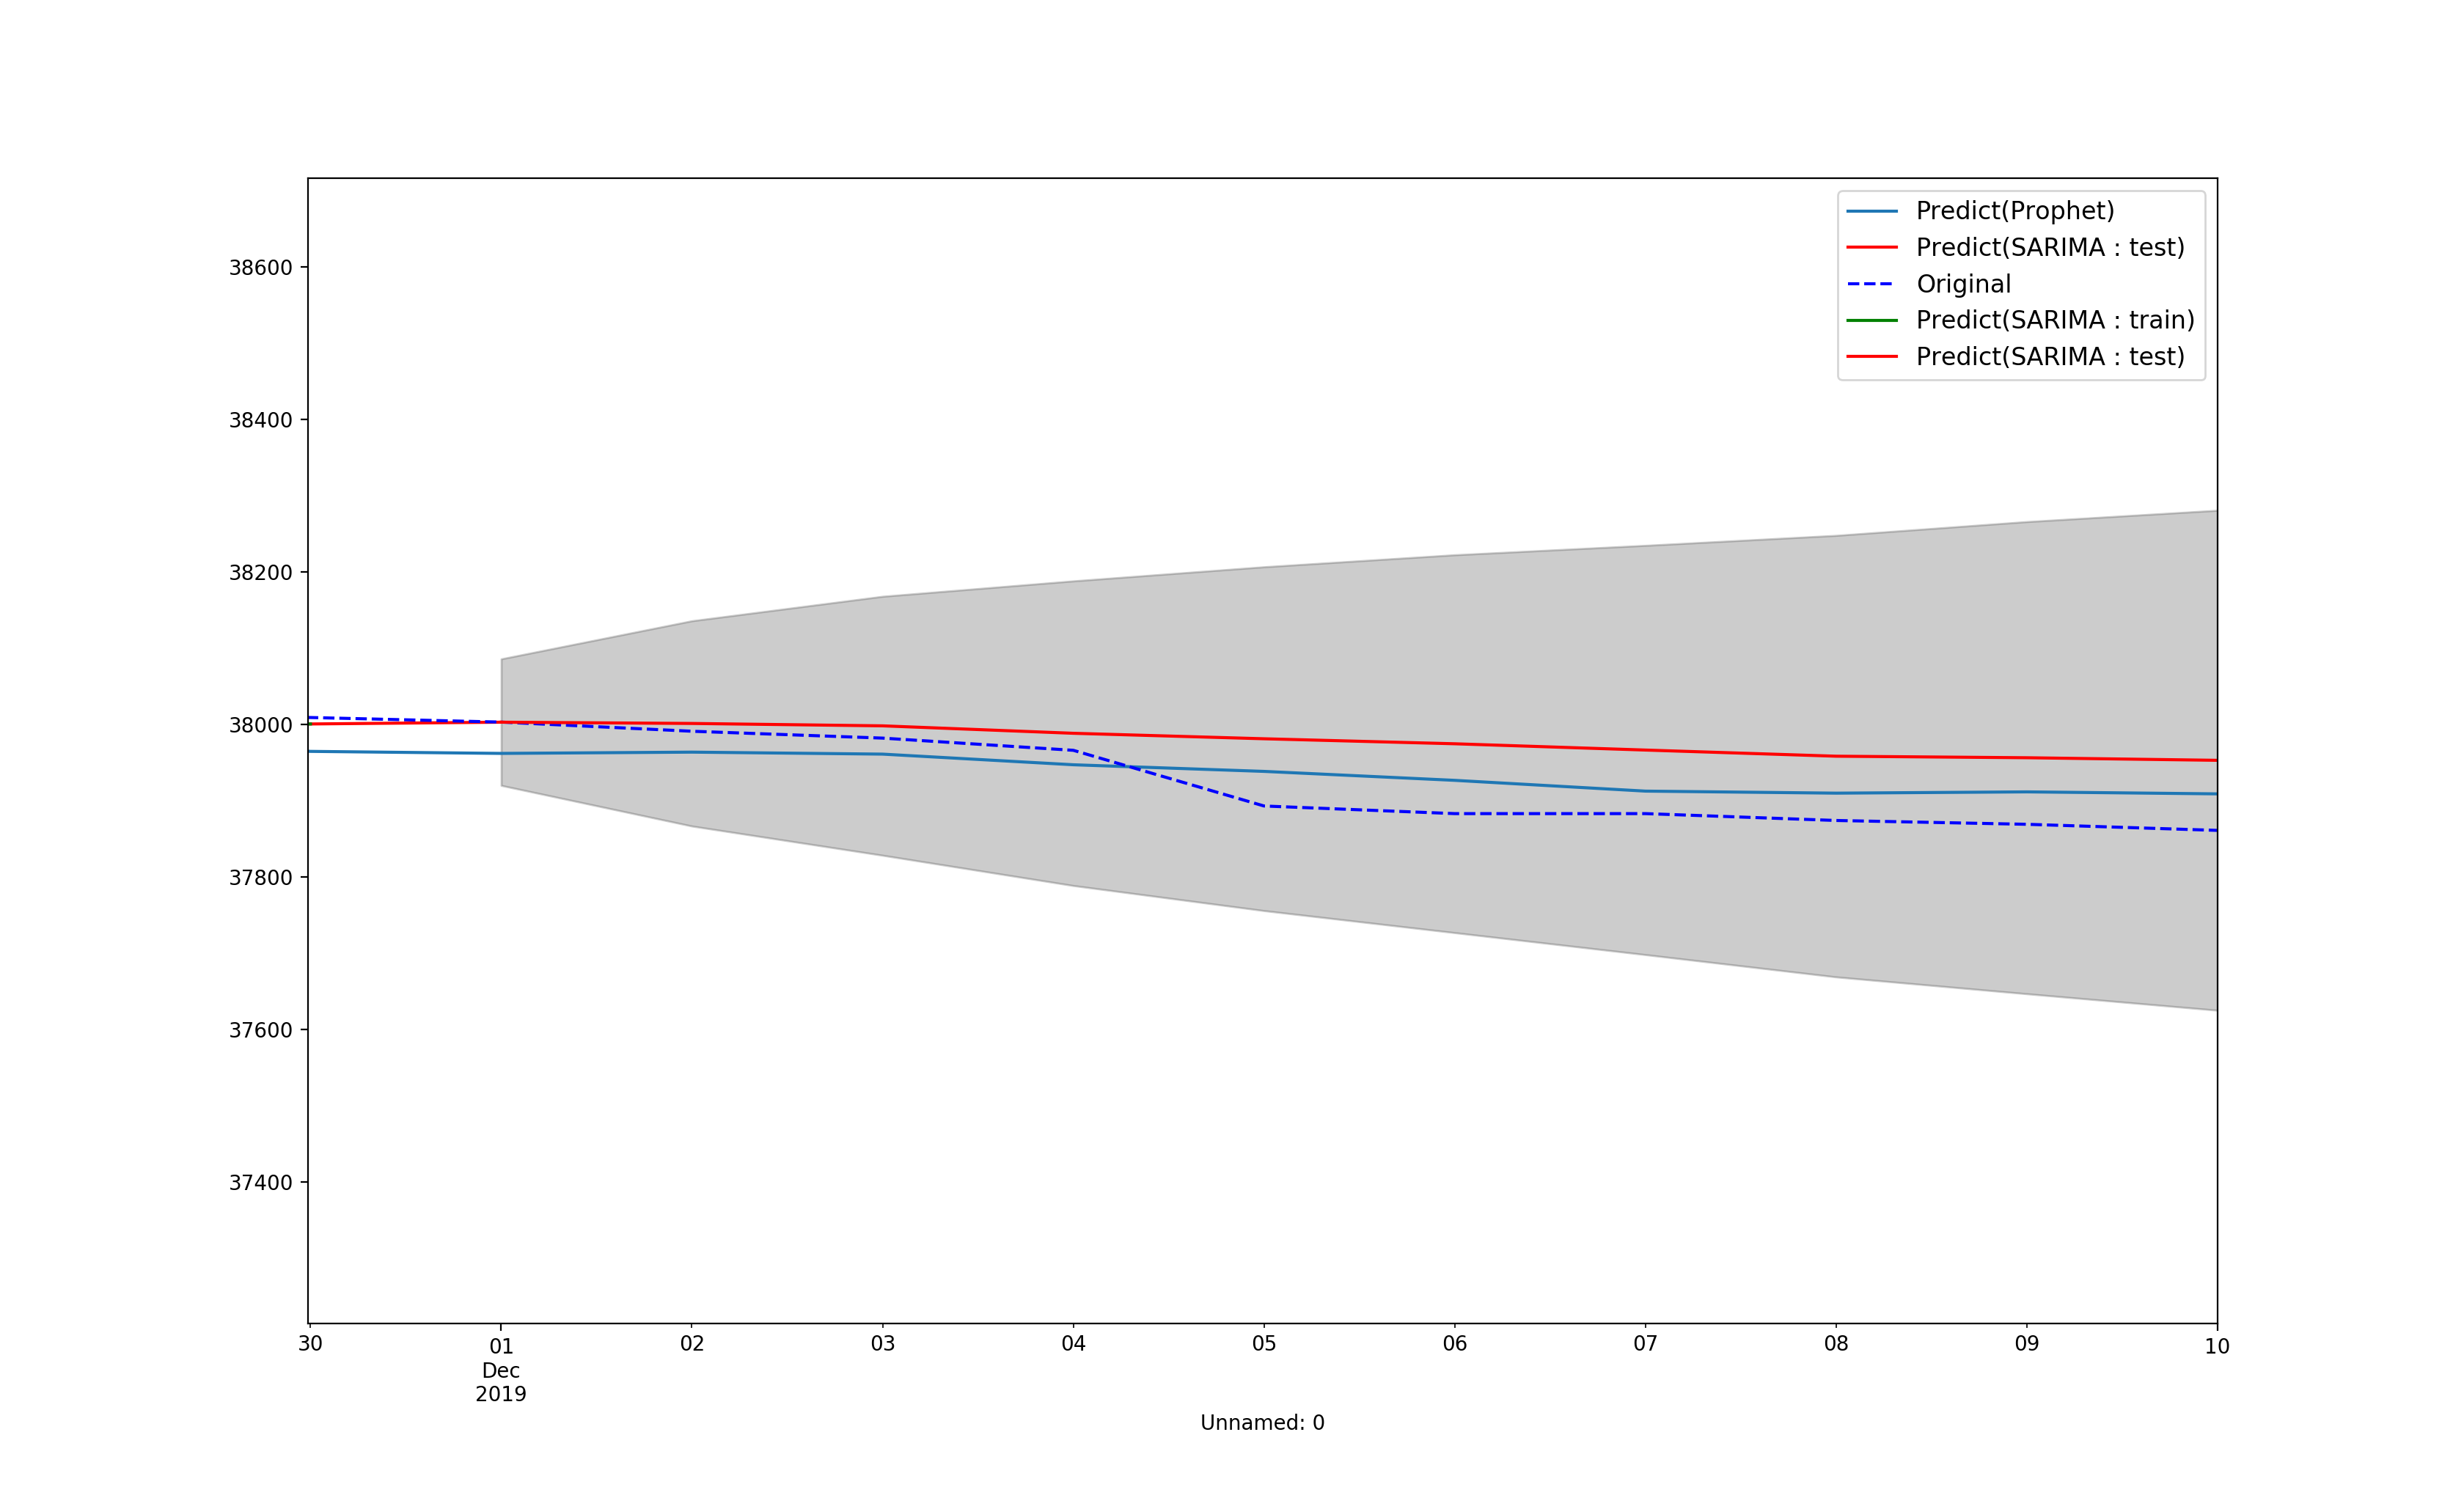
寂しいのでplotしてみる
7. わかったこと
学習データの最終日の翌日の予測データを見てみる。
date, follower

# 実データ
2019-12-01, 38003.000000

# SARIMA
2019-12-01, 38002.878685

# Prophet
2019-12-01, 37958.337506
[予測部分拡大図]を見てもらうとわかると思うけど、SARIMAデータでは学習データの翌日の予測はほぼ一致している。
学習データの次の時点の予測は向いてそう。
Prophetは正直微妙だった。
7. 1日集中で予測させてみる
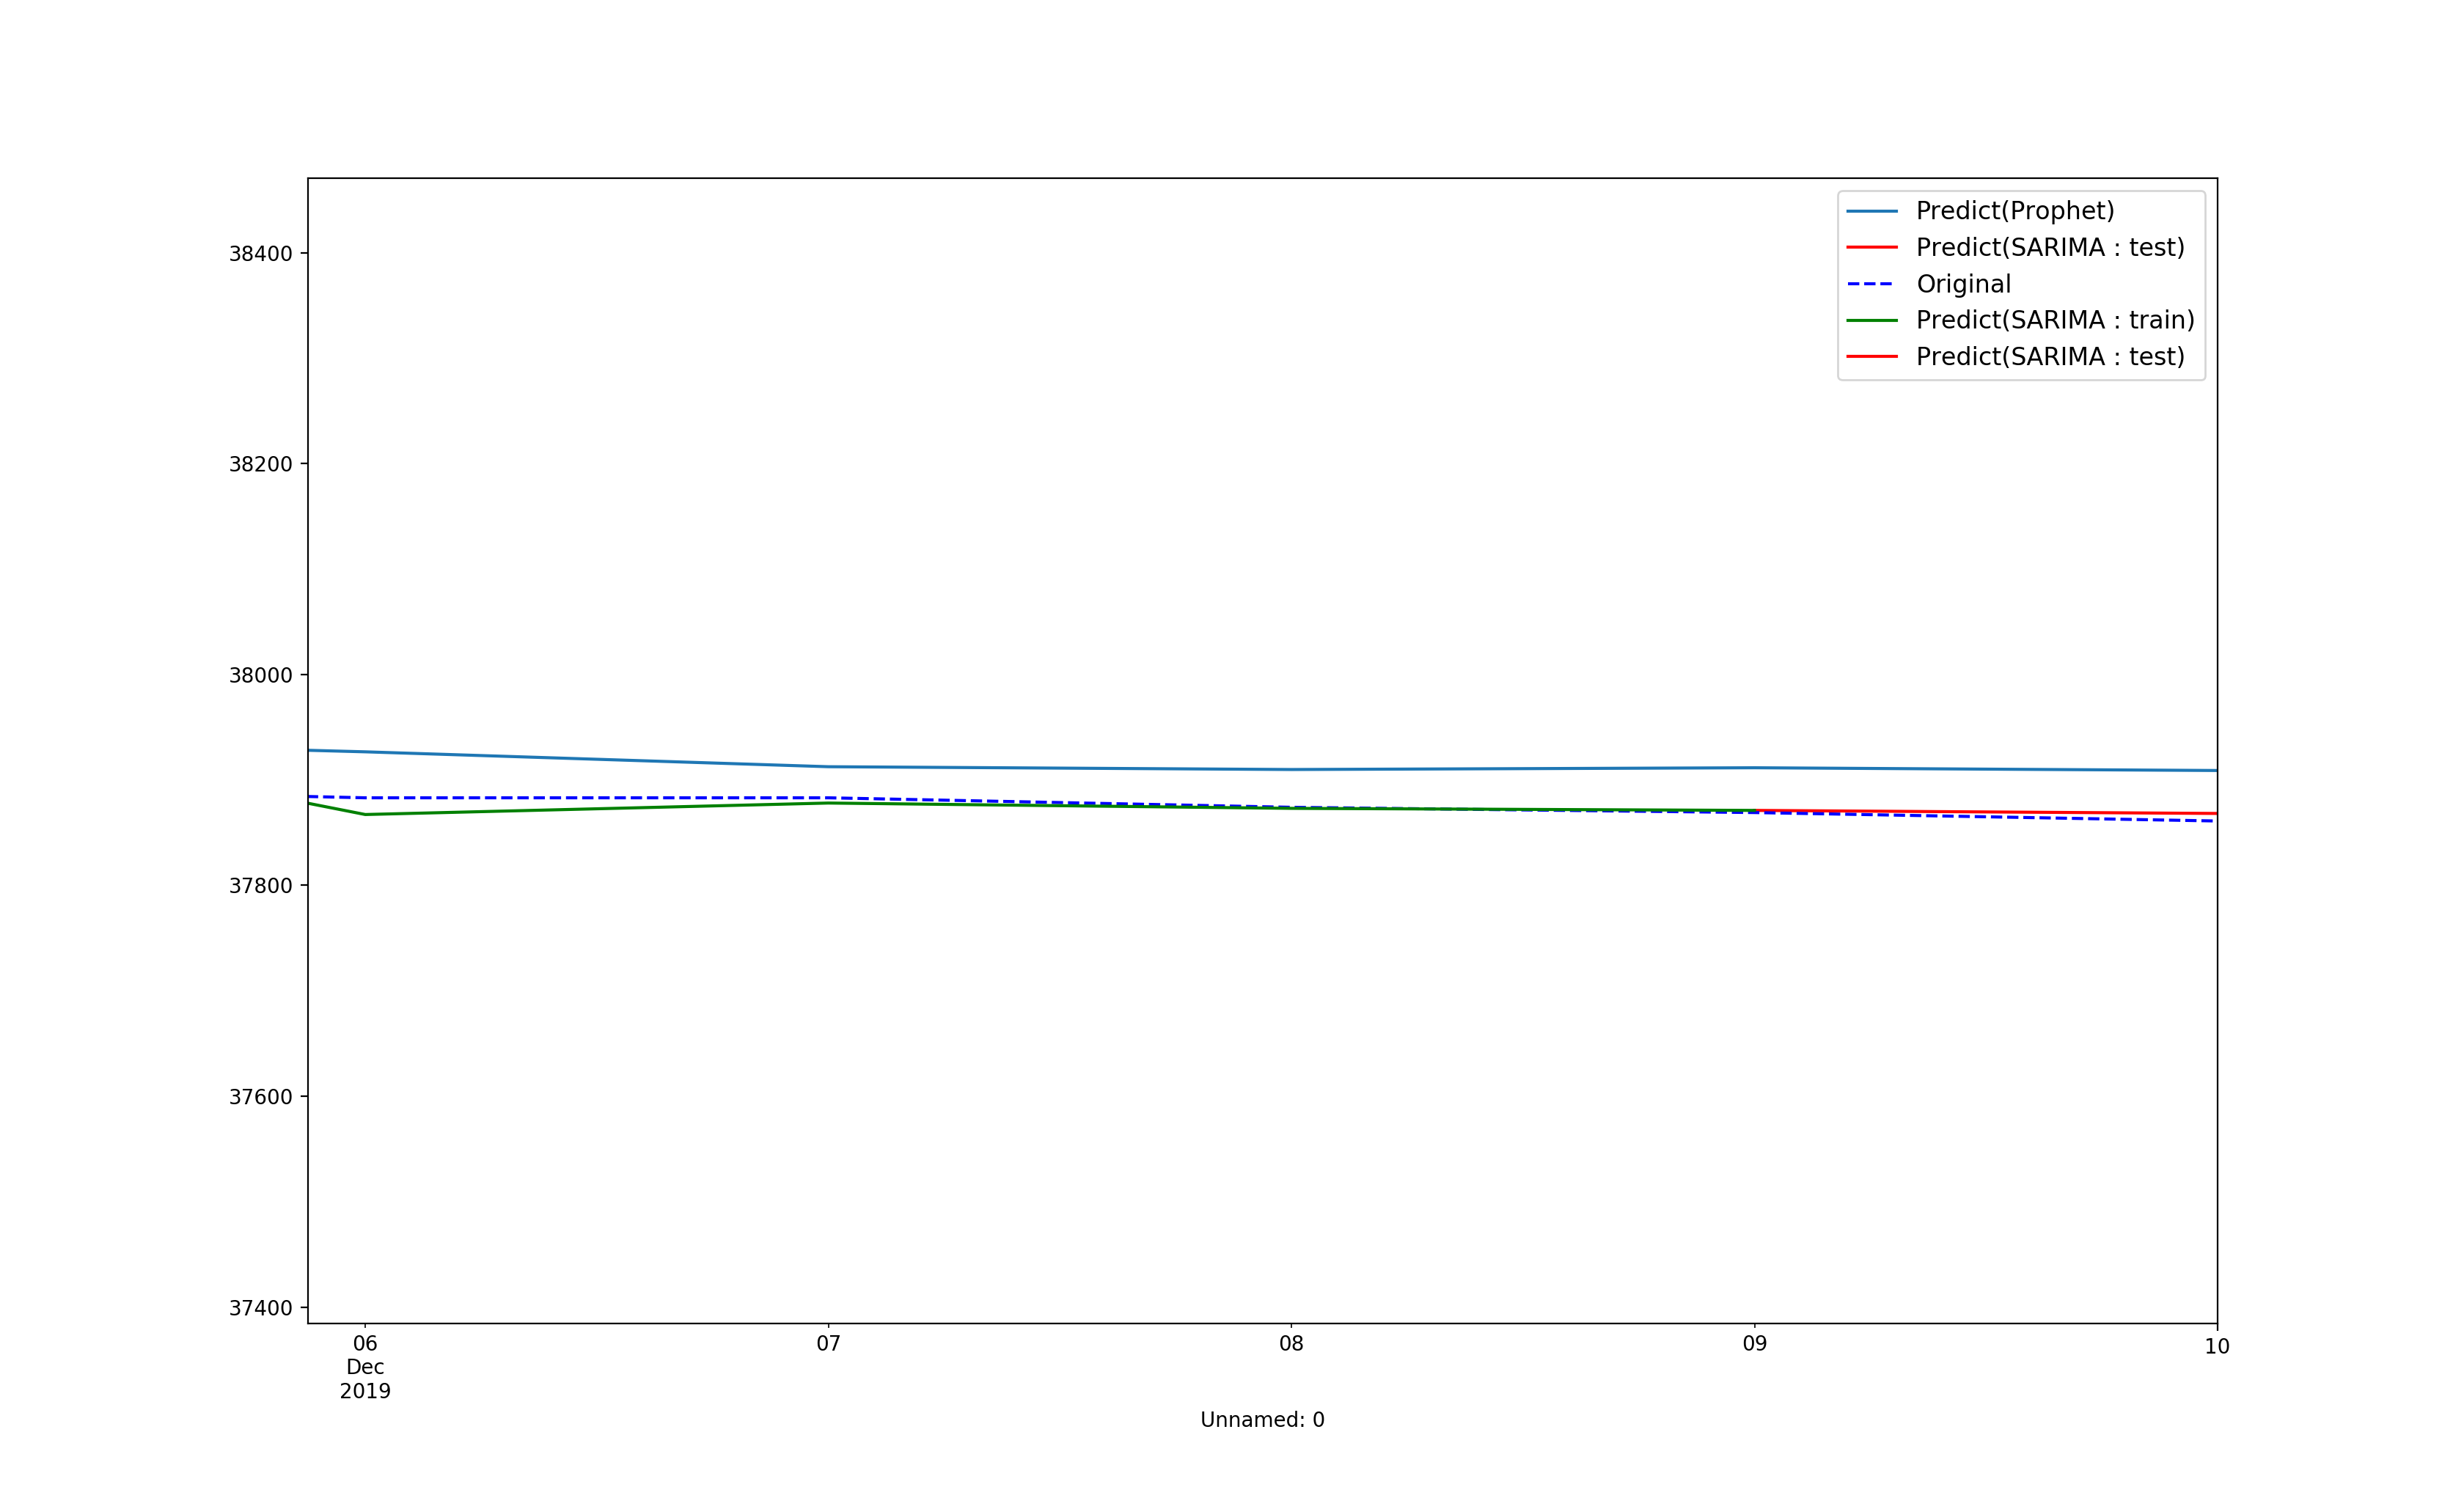
2019/12/09までを学習させて2019/12/10の予測値を出して見れば意外と上手くいくのではないかと考えたのでやってみる。
date, follower

# 実データ
2019-12-10, 37861.000000

# SARIMA
2019-12-10  37868.158032
ボチボチ良い感じ。
やっぱり1日だけの予測だと実用レベルの比較的良い精度が出そう。
何度も言うけど、Prophetは正直微妙だった。
まとめ
Prophetは便利だけど、実用性に欠けるところがあった。
SARIMAモデルだと時系列データの予測は1日だと使えなくもないという感じだった。
もう少し多くのモデルで一気に比較してみたかった。
また次回以降に。
あと、フォロワーは減る。


