はじめに
データはある、問題設定は決まっていない、上司は何か結果を欲しがっている。
この上司を低コストで満足させる方法と思っている。
※ クラスタリング手法の詳しい解説記事ではないよ!
コードと解説
Jupyter Notebookでの実行を想定 (コードはここGithub)
入力: pandasのDataframe
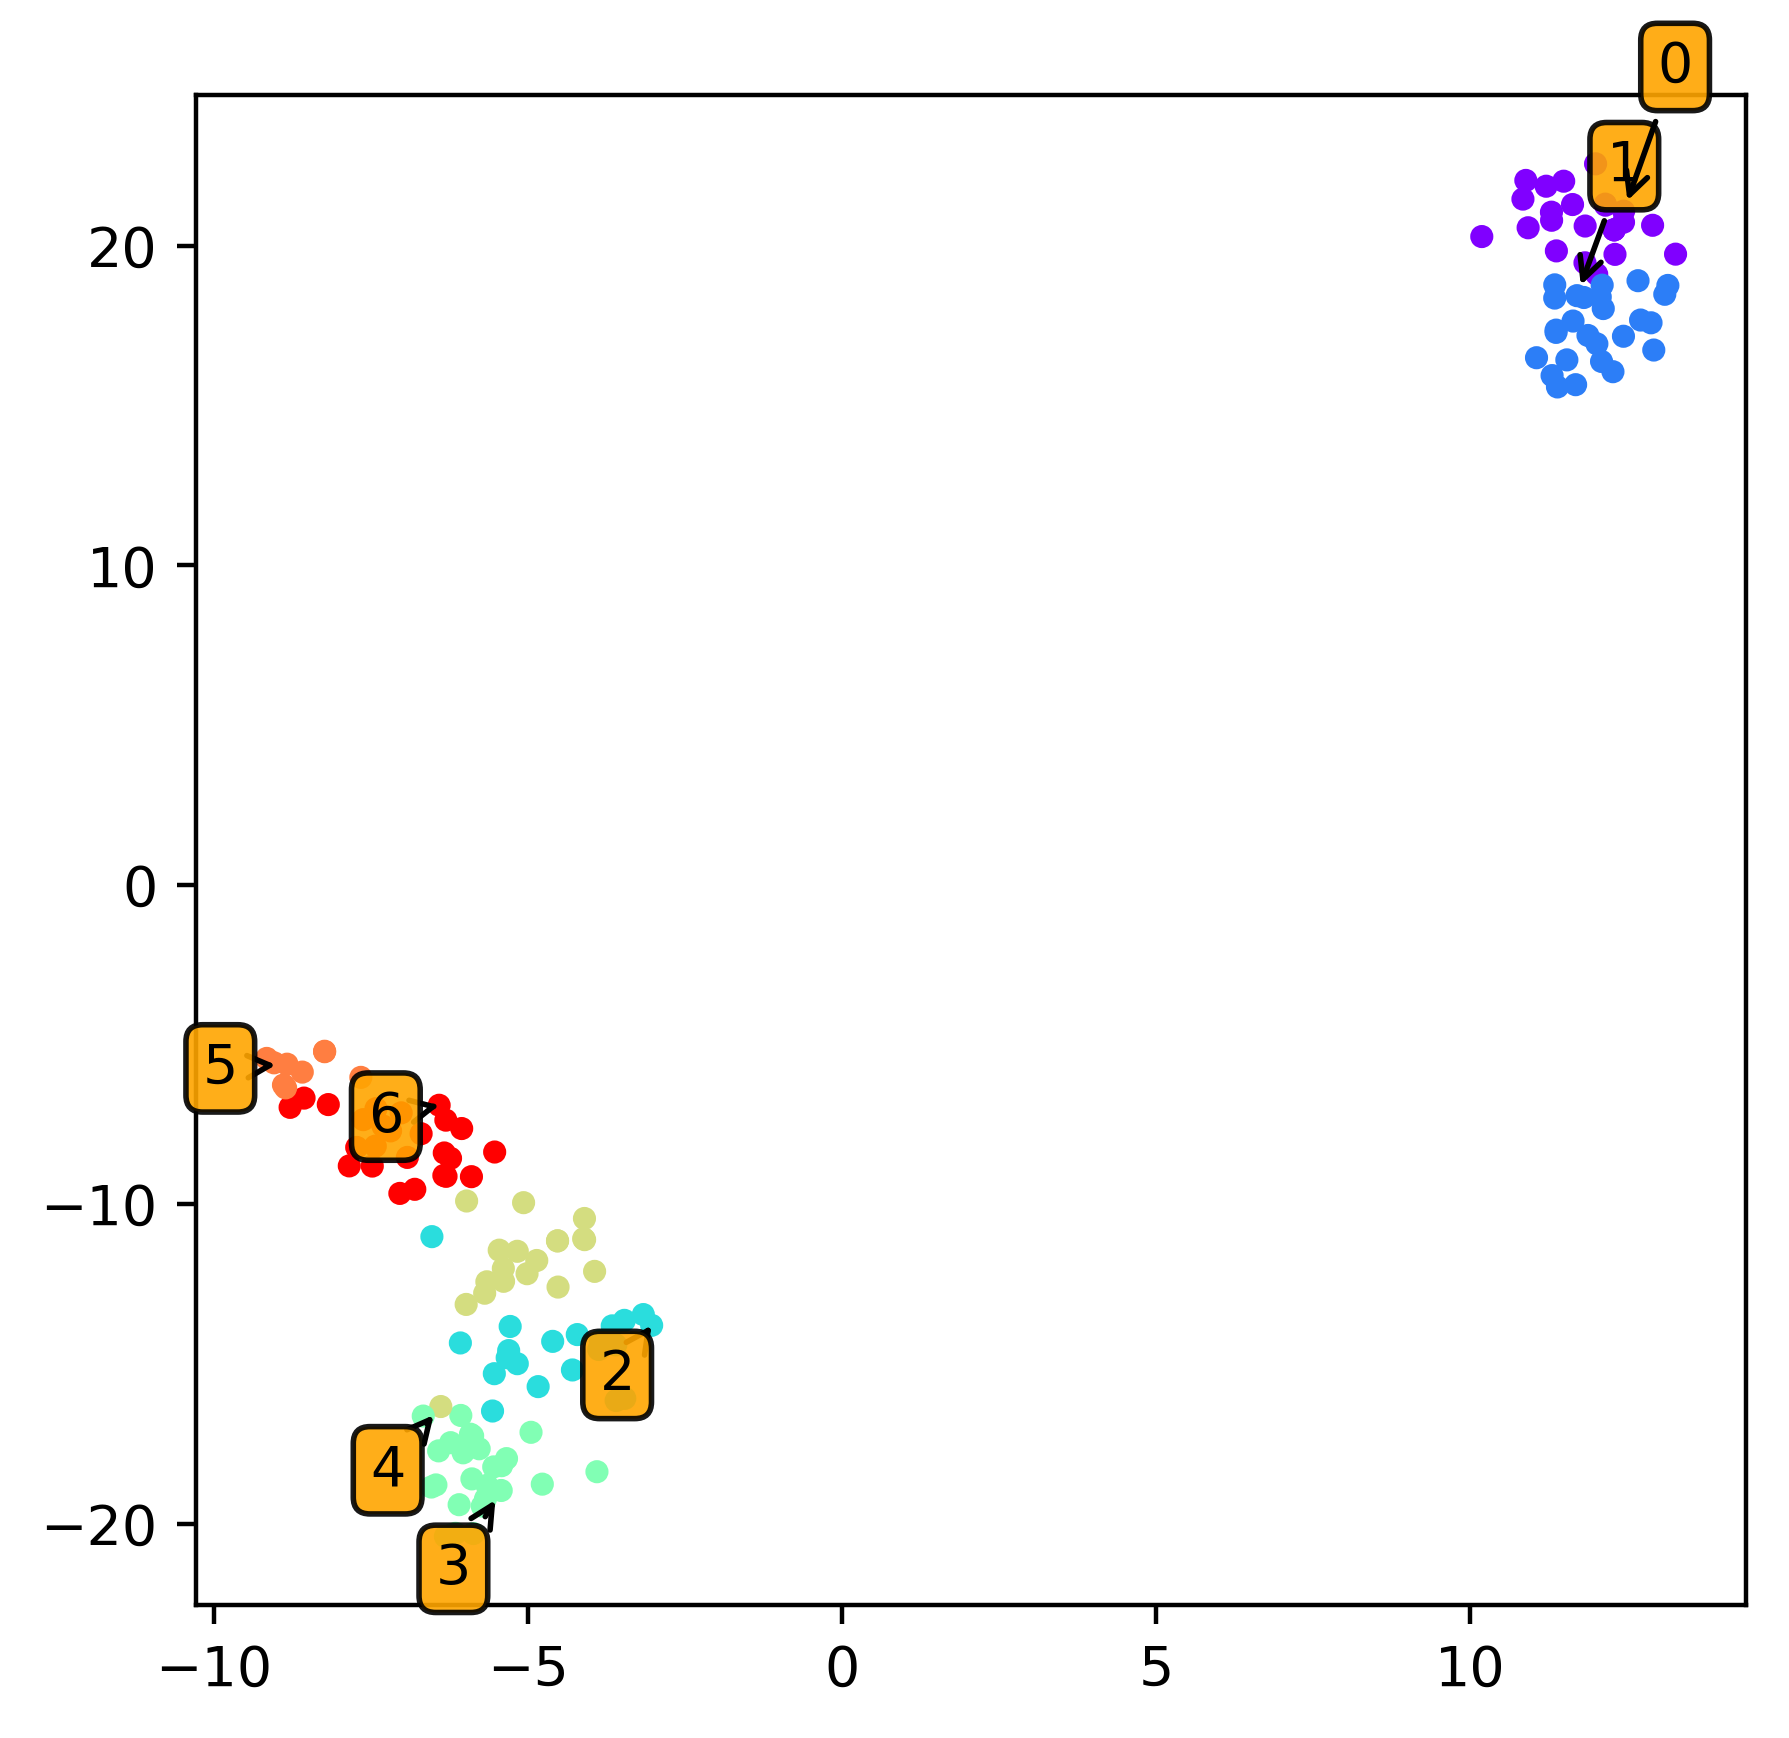
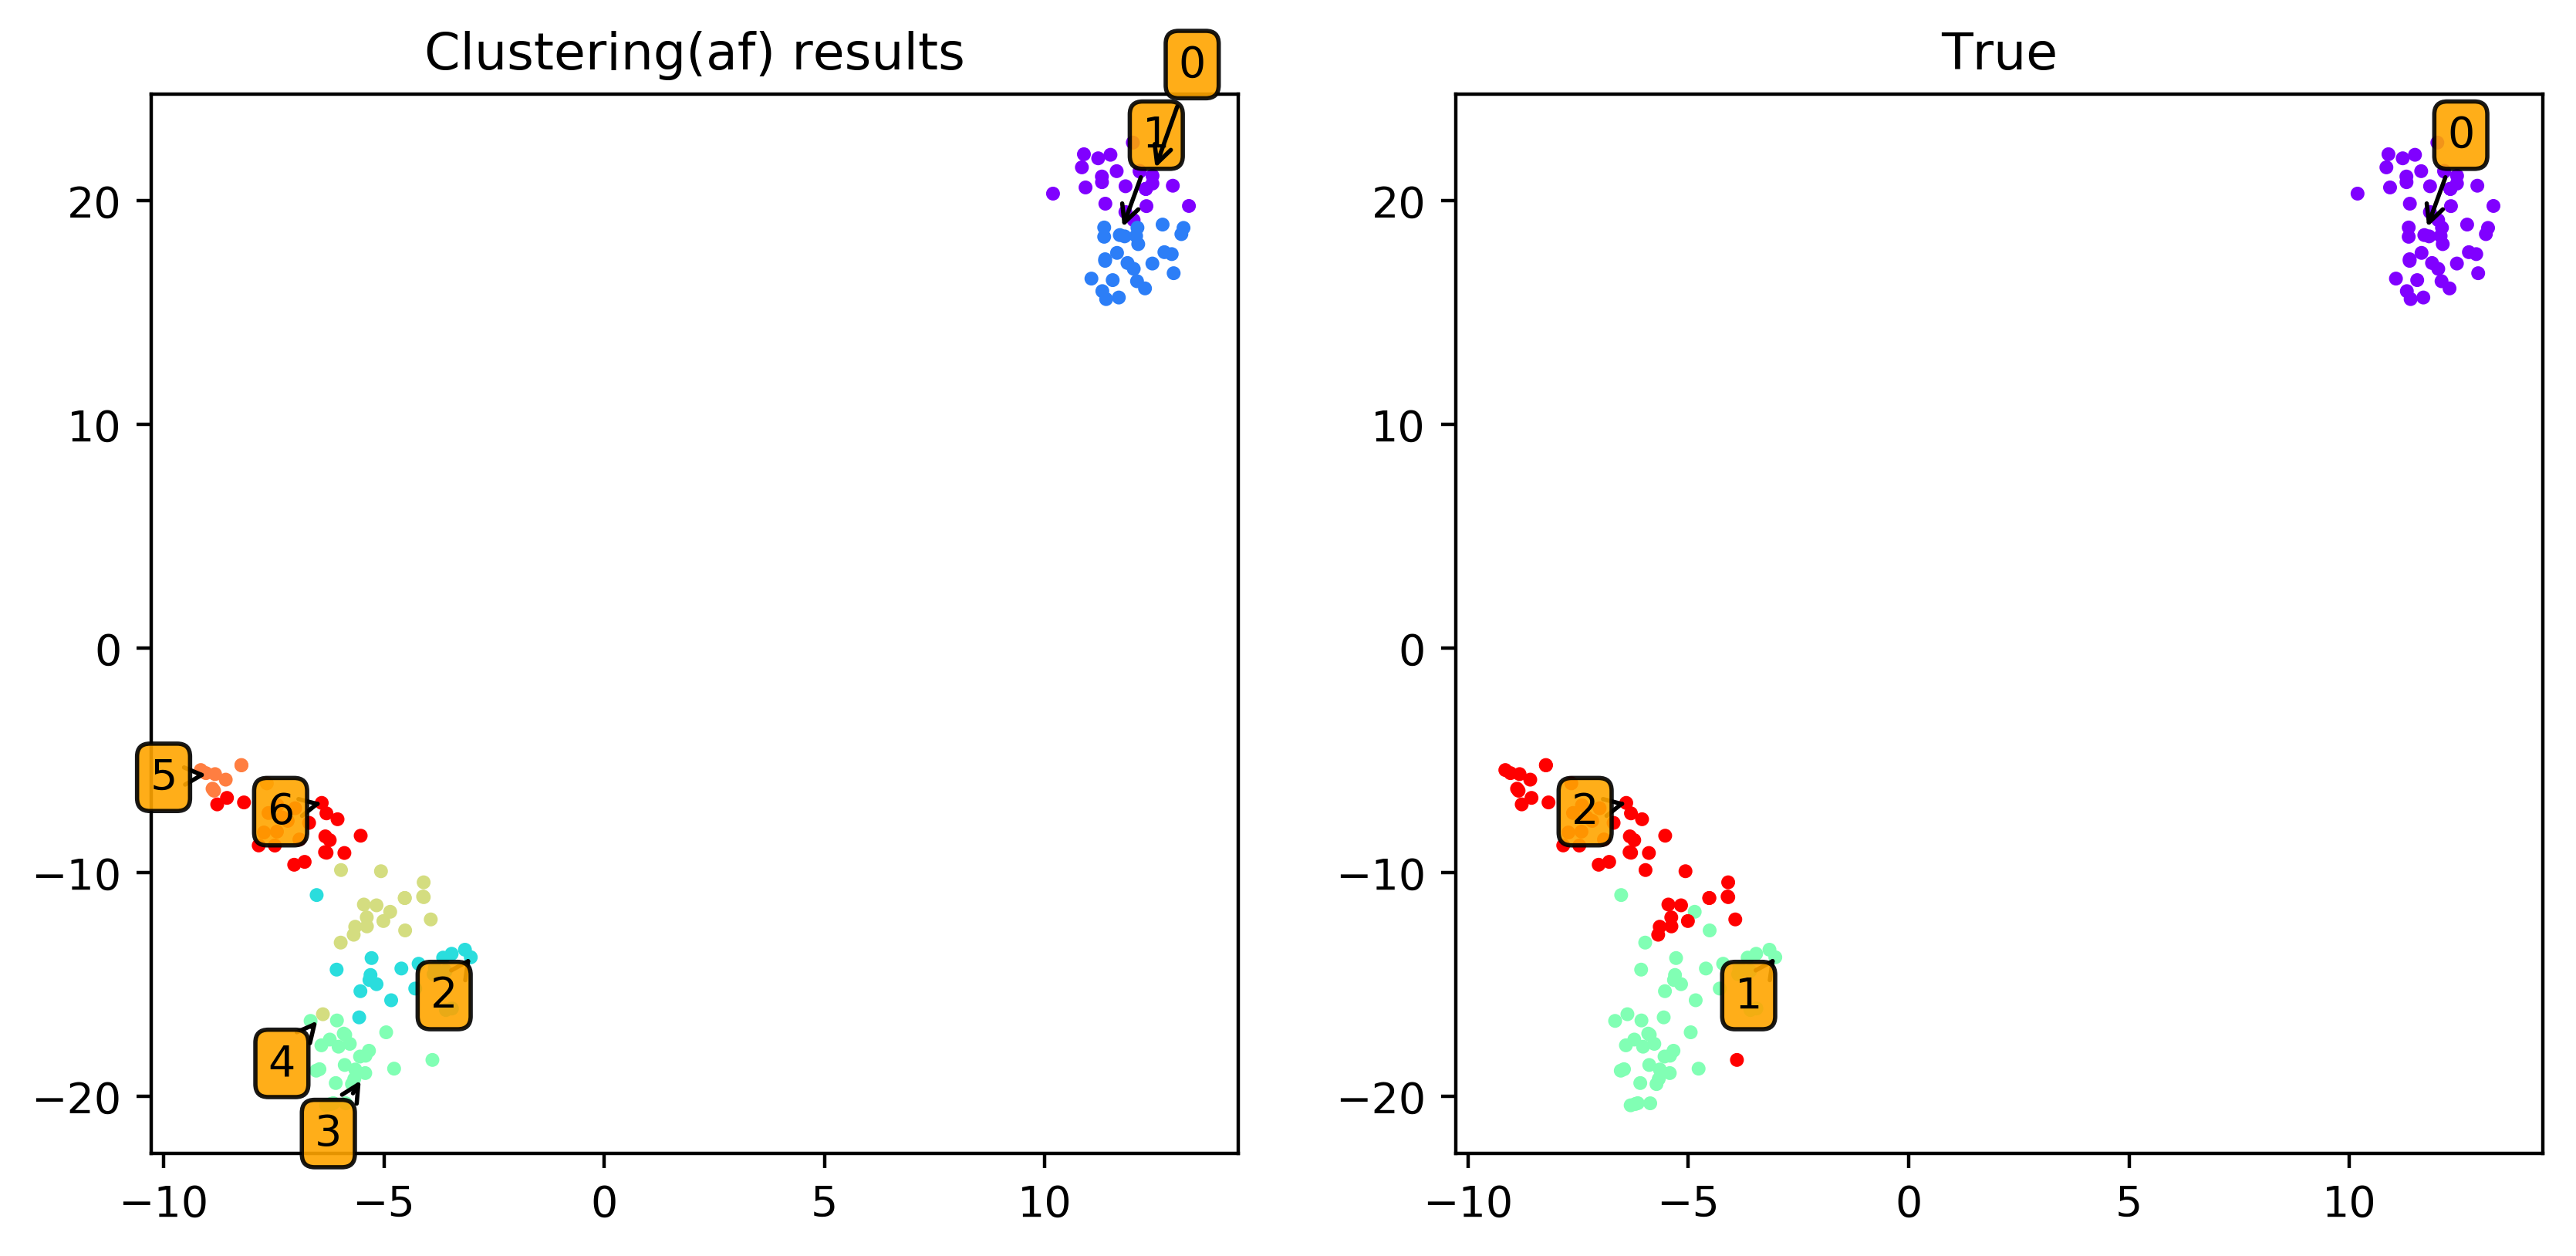
出力: クラスタリング結果の簡単な分析と2次元の可視化
データの確認
import pandas as pd
import seaborn as sns

from sklearn import datasets
iris = datasets.load_iris()

df = pd.DataFrame( iris.data, columns=iris.feature_names )
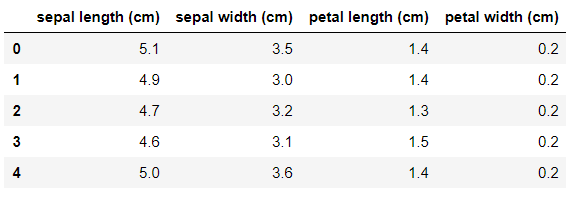
df.head()
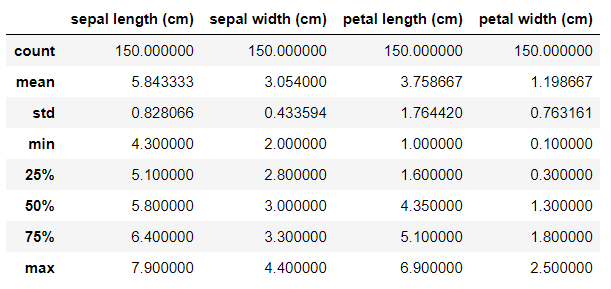
df.describe()
まず、上を見てもらってどんなデータを扱っているか認識してもらう。
クラスタリング
from sklearn.cluster import AffinityPropagation

cluster = AffinityPropagation().fit(df)
label_count = pd.value_counts( pd.Series(cluster.labels_) )
label_count.plot.bar()
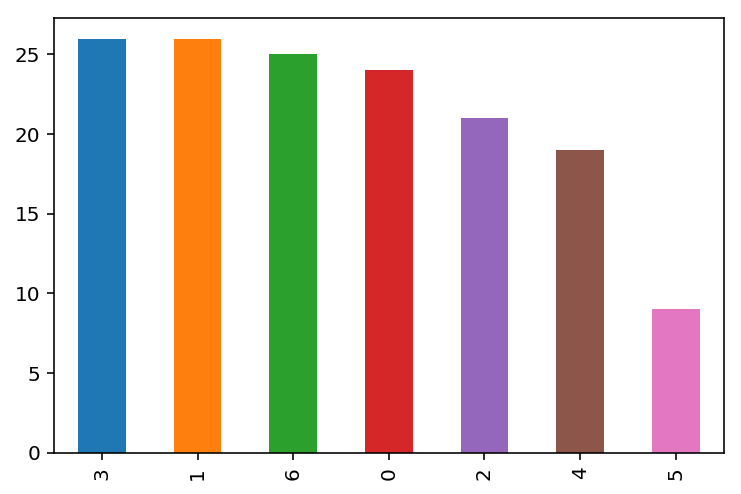
ここでクラスタリング。今回はAffinity Propagationを採用。
(クラスタ数のハイパーパラメータを設定しなくて良いのでこれに、Clustering - sklearnにきれいにまとまってるので適宜選択)
クラスタリング結果の分析
def get_cluster_means( x_tmp, group_tmp ):
    mean_df_tmp= x_tmp.mean()
    mean_df_tmp.name = -1
    for i in range( len( group_tmp ) ):
        c = pd.DataFrame(x_tmp,index=group_tmp[i])
        c_mean = c.mean()
        c_mean.name = i
        mean_df_tmp = pd.concat([mean_df_tmp, c_mean], axis=1)
    return mean_df_tmp.T

mean_df = get_cluster_means( df, groups )
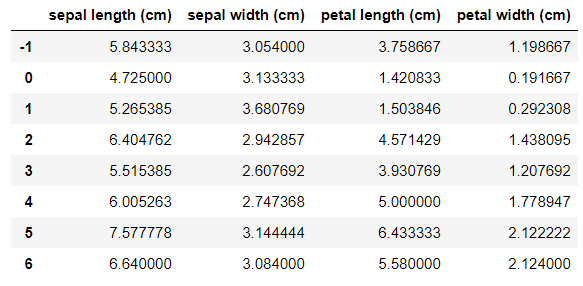
mean_df
各クラスタの特徴量の平均値(平均ベクトル)を表示。インデックス"-1"は全体の平均。
平均と比べて、~特徴量が大きい/小さいということを確認できる。
from sklearn.preprocessing import StandardScaler

tmp = mean_df.drop(-1)
ss = StandardScaler()
result = pd.DataFrame( ss.fit_transform( tmp ), columns=df.columns )
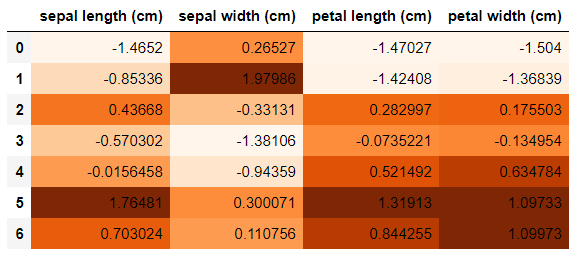
result.style.background_gradient(cmap='Oranges')
各クラスタの平均ベクトルを標準化し、色付けすることにより、各クラスタの性質を強調してます。
sns.clustermap(result.T, linewidths=.5, cmap='Oranges', figsize=(5, 5))
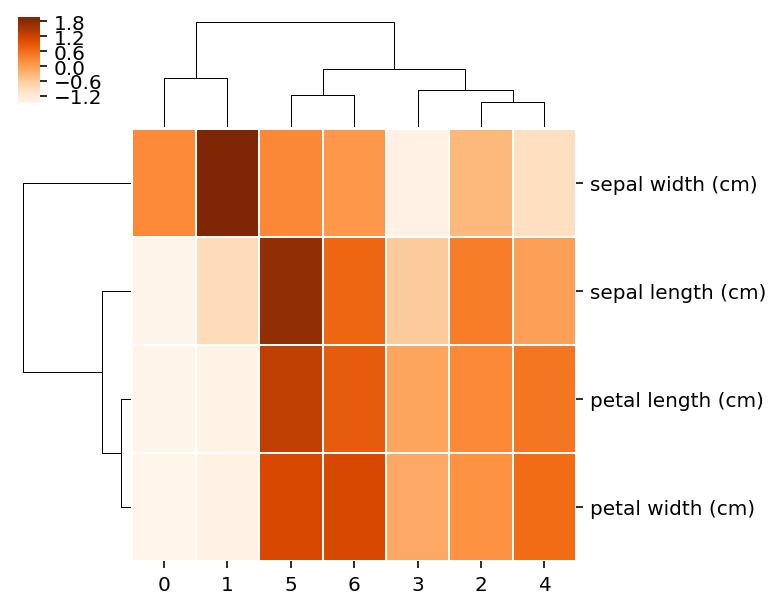
クラスタマップを表示。類似したクラスタ、類似した特徴量を確認できる。
2次元プロット
import matplotlib.pyplot as plt
from sklearn.manifold import TSNE

dim = 2
X_r = TSNE(n_components=dim, random_state=0).fit_transform( df )

fig = plt.figure(figsize=(5,5),dpi=200)
plt.scatter(X_r[:, 0], X_r[:, 1], s=10, cmap=plt.get_cmap('rainbow'), c=cluster.labels_ )

for c_idx, members in groups.items():
    plt.annotate(c_idx, (X_r[:, 0][members[0]],X_r[:, 1][members[0]]),
        textcoords='offset points', ha='right', va='bottom',
        bbox=dict(boxstyle='round,pad=0.3', fc='orange', alpha=0.9),
        arrowprops=dict(arrowstyle = '->', connectionstyle='arc3,rad=0'))

plt.show()
終わりに
pandasやseabornを使った簡単なクラスタリング結果の分析方法でした。
英語でも日本語でも似たような記事やより洗練された記事があったら教えて下さい!
