サマリ
Jupyter notebook でグラフを作ると意図しないタイミングでグラフが描画されたりするのが気になっていろいろ試した結果の自分用メモです。ドキュメントや実装を読んで裏を取ったわけではないので、誤りがあれば教えてください。
- Matplotlib には current figure と呼ばれる、今操作しているグラフを格納しておく場所がある
-
plt.plot()などは current figure に対して操作を行う - Current figure は
plt.gcf()で取得できる。Current figure と同様に current axes もあり、plt.gca()で取得できる
-
- Current figure がクリアされる条件はいくつかある
-
plt.show()でグラフを表示するとクリアされる -
plt.close()で明示的にクリアすることもできる。グラフを生成したいが表示はしたくないときに便利 -
plt.figure()などで新しい figure を作ると、current figure がそれに置き換わる - Jupyter notebook では、セルを抜けるとクリアされる
-
- Jupyter notebook における current figure 関連の挙動は少し癖がある
- Jupyter notebook はセルを抜ける際に current figure に格納されているグラフを表示する
- 同じセル内では current figure を共有するが、異なるセルの間では共有されない (セルを抜ける際にクリアするから)
操作するオブジェクトを明示的に指定しない、という文化は慣れが必要ですね……
実験
グラフの描画
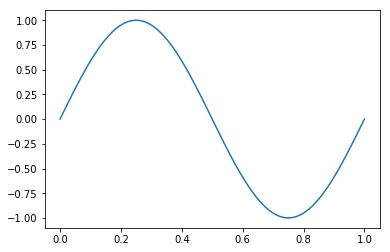
Jupyter notebook 上で以下のコードを打ち込むと、正弦波が表示されます。
ここでは plt.show() のような明示的にグラフを表示するコマンドは打っていませんが、jupyter notebook ではセルを抜ける際に current figure に格納されているグラフを自動的に表示するので問題ありません。
import numpy as np
from matplotlib import pyplot as plt

x = np.linspace(0, 1, 100)
y1 = np.sin(2 * np.pi * x)
y2 = np.sin(4 * np.pi * x)

plt.plot(x, y1)
以下のように、plt.plot() の後に別の処理が続いてもグラフはちゃんと表示されます。
Jupyter notebook にとって大事なのはセルを抜けるタイミングで current figure にグラフがあるか否かであり、plt.plot() を呼び出すタイミングはいつでも構わないからです。
plt.plot(x, y1)
print("hoge")
hoge
Current Figure が共有される範囲
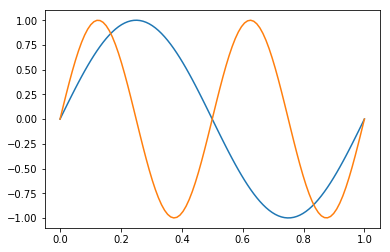
同じセル内では current figure を共有するので、連続して plt.plot() などを呼び出すと同じグラフに重ね書きされます。
plt.plot(x, y1)
plt.plot(x, y2)
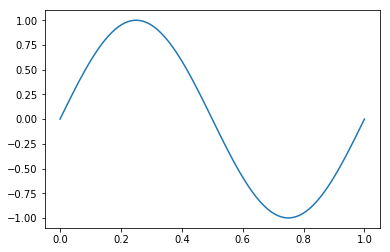
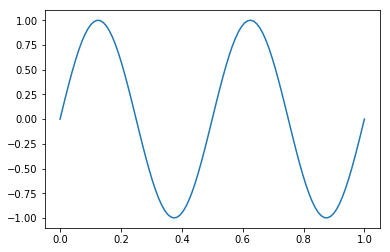
一方で、異なるセル間では current figure は共有されないので、セルを分けるとグラフも別々になります。
plt.plot(x, y1)
plt.plot(x, y2)
Current Figure のクリア
plt.show() でグラフを表示すると current figure がクリアされるので、同じセル内でも別々のグラフとして表示できます。
plt.plot(x, y1)
plt.show()
plt.plot(x, y2)
plt.show()
plt.close() で明示的にクリアすることもできます。
Current figure がクリアされた状態でセルを抜けるので、グラフは表示されません。
plt.plot(x, y1)
plt.close()
明示的に figure を作成したときの current figure の挙動
plt.figure() や plt.subplots() で新しい figure を自分で作った場合、current figure はそれに置き換わります。
figure, ax = plt.subplots()  # 新しい figure を生成
plt.plot(x, y1)  # current figure を通して新しく生成した figure を更新
figure # セルをまたぐと current figure はクリアされるが、figure は生きている
plt.close() と組み合わせることで、グラフの生成だけ行い notebook 上には表示しないことも可能です。
figure, ax = plt.subplots()
ax.plot(x, y1)
plt.close()  # current figure をクリアし、notebook 上にグラフが表示されないようにする
figure # セルをまたぐと current figure はクリアされるが、figure は生きている