概要
(1)はこちら:https://qiita.com/murr83/items/bddd49025fd95c07dbbf
サイモンベニンガ著『ファイナンシャル・モデリング』(2017、ロキガ書房)の内容をPythonで実装してみました。本記事は本のp196-199に該当します。
1. 銘柄別の日次収益率データを読み込む
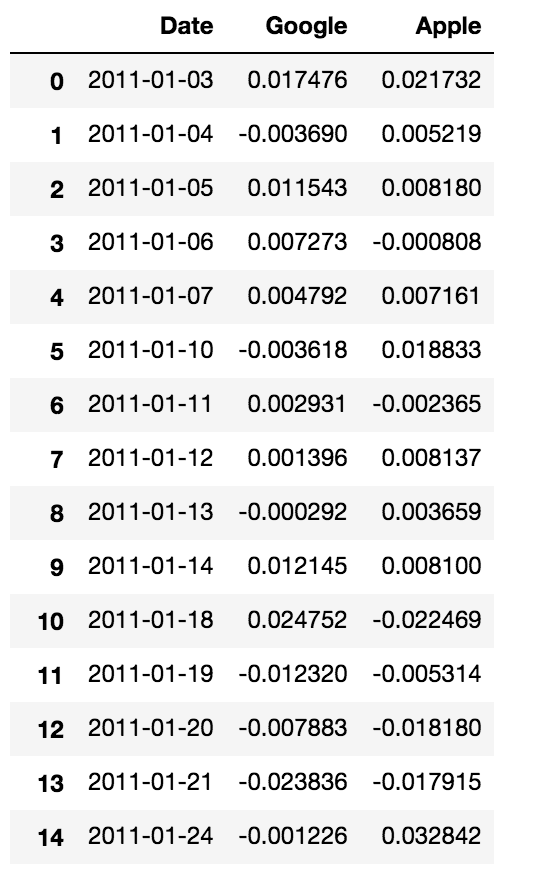
(1)の記事で作ったグーグルとアップルの2011年のデータを引き続き使います。前回はdailyと名付けていましたが、今回はdataという名前でインポートします。
data = pd.read_csv('daily.csv')
2. 二資産からなるポートフォリオを作る
アップル社への投資比率をxとおき、xを変化させた時のポートフォリオ全体での収益率の変化を調べて見ましょう。
# 二社の収益率の平均を求める
gg_mean_return = np.mean(data['Google'])
app_mean_return = np.mean(data['Apple'])
# 二社の収益率の分散を求める
# 二社の収益率の共分散を求める
cov_matrix = np.cov(data['Google'], data['Apple'])
gg_var_return = cov_matrix[0,0]
app_var_return = cov_matrix[1,1]
cov_return = cov_matrix[1, 0]


# -0.5~1.5までのベクトルを用意
xs = np.arange(-5, 16) * 0.1
# ポートフォリオの収益率の入れ物を用意
portfolio_returns = np.zeros(len(xs))
# ポートフォリオの標準偏差の入れ物を用意
portfolio_stds = np.zeros(len(xs))

# それぞれのxに対し、ポートフォリオの収益率と標準偏差を計算
for i in range(len(xs)):
    x = xs[i]
    portfolio_returns[i] = app_mean_return*x + gg_mean_return*(1-x)
    portfolio_stds[i] = np.sqrt((x**2)*app_var_return + 2*x*(1-x)*cov_return +((1-x)**2)*gg_var_return)
以下でコードを順番に解説します。
1. dataの統計量を求める
まずは平均から始めます。
dataのGoogle列、Apple列をそれぞれ呼び出して、numpyのmeanメソッドで平均を求めます。それぞれgg_mean_return, app_mean_returnと名付けています。
gg_mean_return = np.mean(data['Google'])
app_mean_return = np.mean(data['Apple'])
次に分散と共分散を求めます。numpyのcov()メソッドを使うと分散共分散行列が返ってきます。右上と左下の要素が共分散、左上の要素がGoogleの分散、右下の要素がAppleの分散です。
cov_matrix = np.cov(data['Google'], data['Apple'])
gg_var_return = cov_matrix[0,0]
app_var_return = cov_matrix[1,1]
cov_return = cov_matrix[1, 0]
2. xを変化させる
numpy.arange()を使って-0.5~1.5までの値が0.1おきに入った行列を作ります。
xs = np.arange(-5, 16) * 0.1
実際に実験する前に結果を入れるための入れ物を作っておきましょう。
portfolio_returns = np.zeros(len(xs))
portfolio_stds = np.zeros(len(xs))
いよいよ本題のxを変化させる作業に入ります。
for i in range(len(xs)):
    x = xs[i]
    portfolio_returns[i] = app_mean_return*x + gg_mean_return*(1-x)
    portfolio_stds[i] = np.sqrt((x**2)*app_var_return + 2*x*(1-x)*cov_return +((1-x)**2)*gg_var_return)
ここでは期待値と分散に関する次の公式を使っています。
E[\alpha X_1+\beta X_2] = \alpha E[X_1] + \beta E[X_2]\\
V[\alpha X_1+\beta X_2] = \alpha^2 V[X] + 2\alpha\beta cov[X_1, X_2] + \beta~^2 Var[X_2]
このfor文によってportfolio_returnとportfolio_stdには実験の結果が入りました。
見やすくするために次のような処理を行えば、
# DataFrameにして見やすくする
portfolio = pd.DataFrame({'x': xs, 'return': portfolio_returns, 'std': portfolio_stds})

# x列をインデックスに指定
portfolio = portfolio.set_index('x')

というように結果が分かります。

お疲れ様でした。
宣伝
SmartTrade社では毎週水曜日18:00から勉強会を行っています。(https://python-algo.connpass.com/)
