1
0

Delete article

Deleted articles cannot be recovered.

Draft of this article would be also deleted.

Are you sure you want to delete this article?

カーネル密度関数でタイタニックの必要な変数を見つける

Posted at

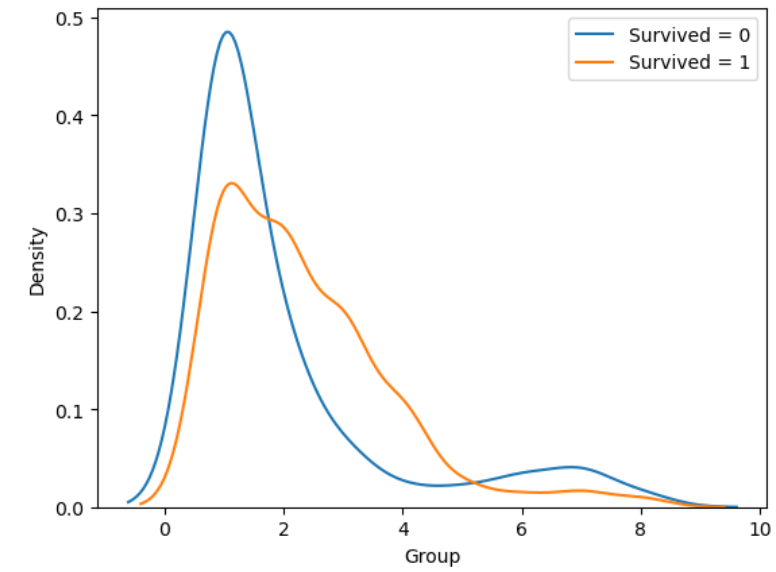
ヒストグラム以外で分かりやすく特徴量の分布を表してくれるものとしてカーネル密度関数というものがあるのですが、これを今回使って有効的な特徴量を探してみようと思います。

カーネル密度関数

for col in df_train.columns:
    try:
        sns.kdeplot(df_train[df_train["Survived"]==0][col], label="Survived = 0")
        sns.kdeplot(df_train[df_train["Survived"]==1][col], label="Survived = 1")
        plt.legend()
        plt.show()
    except:
        _ = 0

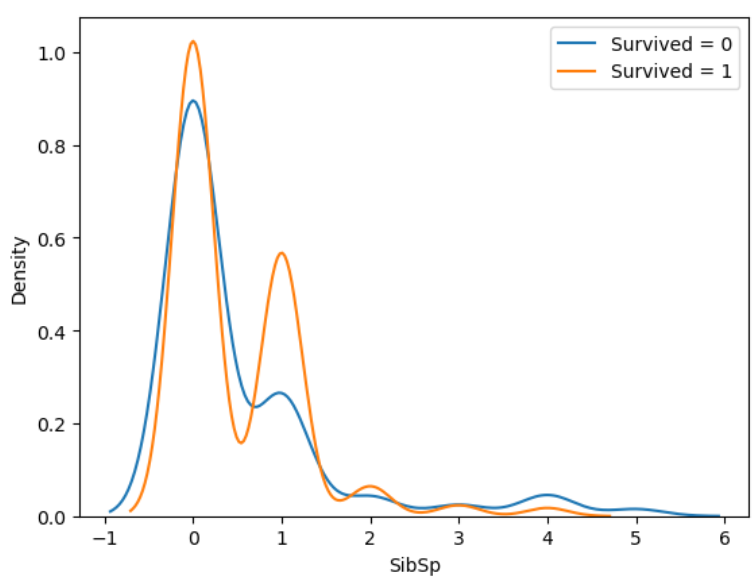
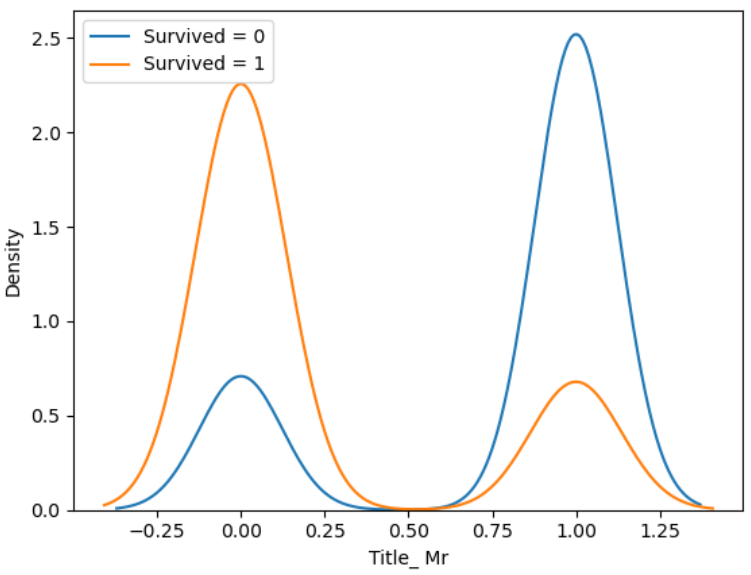
ここで見つけた分布が異なる特徴量がこれでした。
image.png
image.png
image.png
image.png
image.png
image.png
image.png
image.png
と、ここから変数選択してなんやかんや77.272%となりました。
予測手法はhold-outを200回訓練データと検証用データを変えて学習させ上位3位のモデルを使って多数決で予測するという手法です。

1
0
0

Register as a new user and use Qiita more conveniently

  1. You get articles that match your needs
  2. You can efficiently read back useful information
  3. You can use dark theme
What you can do with signing up
1
0

Delete article

Deleted articles cannot be recovered.

Draft of this article would be also deleted.

Are you sure you want to delete this article?