やりたいこと
箱ひげ図は分布形状を知るのに便利だけど、具体的な数値も知りたいところです。
当然summary()でもいいんですが、どうせなら一遍に知りたいし伝えたいので、
箱ひげ図に要約統計量を書きたいです。
とりあえずそれだけならstat_summary()でOK。
やったこと
ただこれだけだとnが分からないので、以下を丸々参考に記載。
StatN <- ggproto("StatN", Stat,
                 required_aes = c("x", "y"),
                 compute_group = function(data, scales) {
                   y <- data$y
                   y <- y[!is.na(y)]
                   n <- length(y)
                   data.frame(x = data$x[1], y = min(y), label = paste0("n=", n))
                 }
)

stat_n <- function(mapping = NULL, data = NULL, geom = "text",
                   position = "identity", inherit.aes = TRUE, show.legend = NA,
                   na.rm = FALSE, ...) {
  ggplot2::layer(stat = StatN, mapping = mapping, data = data, geom = geom,
                 position = position, inherit.aes = inherit.aes, show.legend = show.legend,
                 params = list(na.rm = na.rm, ...))
}
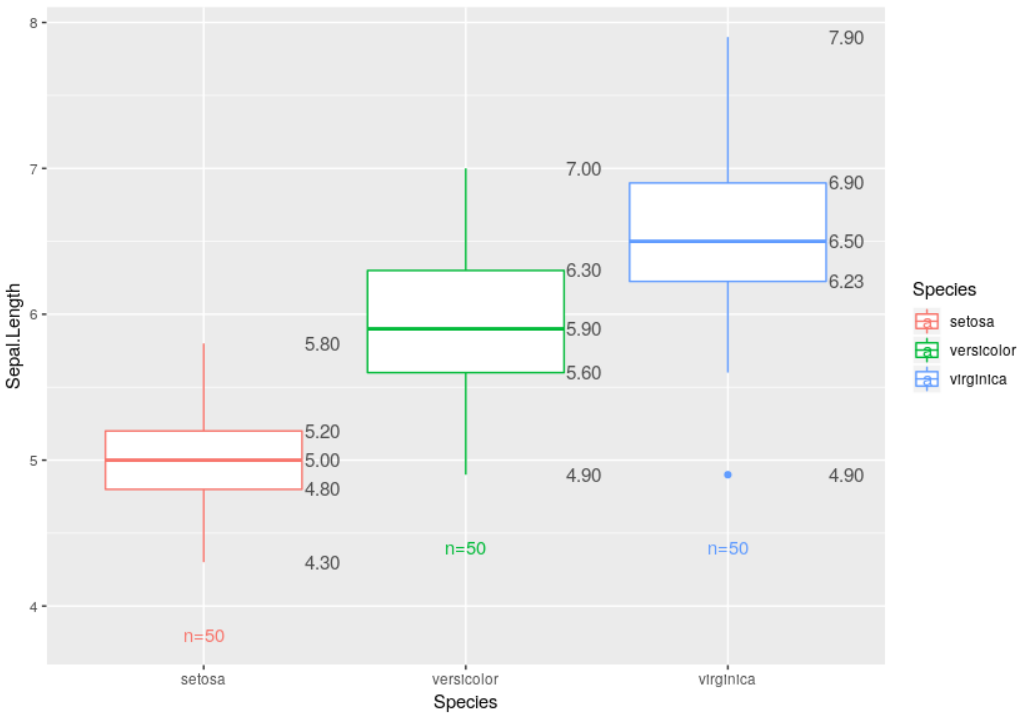
全部載せたのがこちら
ggplot(iris, aes(Species, Sepal.Length, colour = Species))+
  geom_boxplot()+
  stat_summary(geom = "text", fun.y = quantile,
               aes(label = sprintf("%1.2f", ..y..)),
               position = position_nudge(x=0.45), size=4,
               colour = "gray30")+
  stat_n(position = position_nudge(y = -0.5))
もうちょい見栄えをよくしたいけども、
まぁそれは今後の課題ということで。