はじめに
高専祭で売り上げデータをfirebaseから取得してグラフ化するWebサイトを作ったので備忘録として残す。
もし来年も似たようなことをするようなのであればぜひ役立ててもらいたい。
firebaseとは
googleが買収したサービスで静的Webのホスティングだったり、今回使うデータベースでデータの読み書きなど、色々できる。
サイト概要
- データを取得し、売り上げグラフを表示
- データは売り上げ個数と時間の情報を持っているので売り上げ履歴として表示
- 高専祭は2日間なので日付ごとに分ける
- グラフは時間ごとに分ける
- 商品数によってタブを切り替える
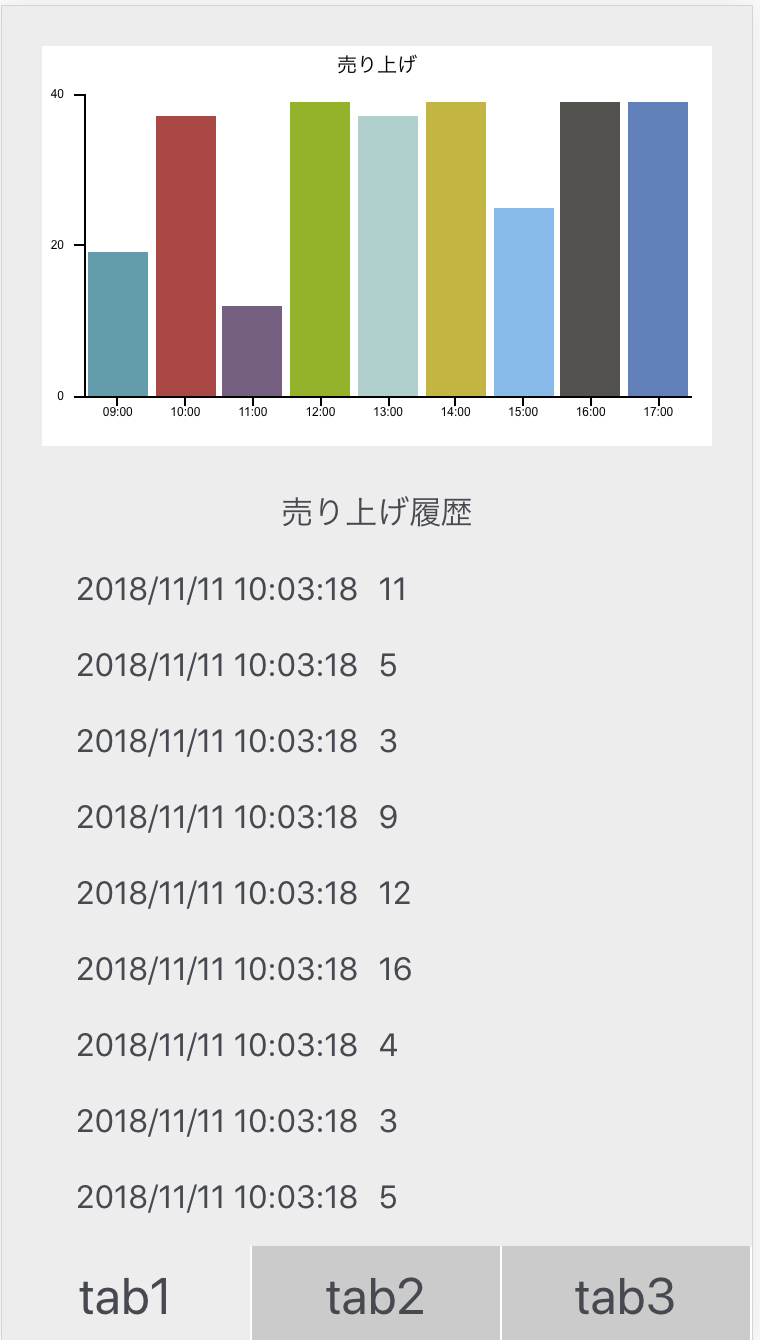 表示するとこんな感じになる。
ソースコード
index.html
<!DOCTYPE html>
<html lanf="ja">
<head>
  <title>売り上げ</title>
  <meta charset="utf-8">
  <meta name="viewport" content="width=device-width, initial-scale=1">
  <meta http-equiv="X-UA-Compatible" content="ie=edge">
  <link rel="stylesheet" href="style/common.css">
  <link rel="stylesheet" href="style/main.css">
  <script type="text/javascript" src="js/history.js"></script>
  <script type="text/javascript" src="js/graph.js"></script>
  <script type="text/javascript" src="https://ajax.googleapis.com/ajax/libs/jquery/1.9.1/jquery.min.js"></script>
</head>
<body>
  <script src="js/tab-bar.js"></script>
  <div class="main-container">
    <ul class="tab">
      <li class="select">tab1</li>
      <li>tab2</li>
      <li>tab3</li>
    </ul>
    <ul class="content">
      <li>
        <div id="stage0"></div>
        <div id="wrapper0">
          <p class="title">売り上げ履歴<br></p>
        </div>
      </li>
      <li class="hide">
        <div id="stage1"></div>
        <div id="wrapper1">
          <p class="title">売り上げ履歴<br></p>
        </div>
      </li>
      <li class="hide"></li>
    </ul>
<script src="https://cdn.firebase.com/js/client/2.4.1/firebase.js"></script>
<script src="https://www.gstatic.com/firebasejs/5.5.6/firebase.js"></script>
<script src="https://cdnjs.cloudflare.com/ajax/libs/canvasjs/1.7.0/canvasjs.min.js"></script>
<script>
  // Initialize Firebase
  var config = {
    apiKey: "**--------------------------**",
    authDomain: "*********.firebaseapp.com",
    databaseURL: "https://*********.firebaseio.com",
    projectId: "********",
    storageBucket: "******.appspot.com",
    messagingSenderId: "**--------------**"
  };
  var num = "master";//出店番号
  var item = 0;//商品番号
  firebase.initializeApp(config);
  dataTimeTotal(canvas,num,item);
  history(num,item);
  item = 1;
  dataTimeTotal(canvas,num,item);
  history(num,item);
</script>
</body>
</html>
graph.js
//その時間の売り上げ個数算出
function dataTimeTotal(callback,num,item) {
  var i = 0;
  var path;
  var total = [];
  var database = firebase.database();
  path = String(num+"/"+item+"/10/");//当日は"master/"が消える
  var dataRef = database.ref(path);
  dataRef.once("value").then(function(snapshot) {
    for(let i = 0;i < 9;i++){//9:00~17:00繰り返し
      if(i==0){
        var dataNum = snapshot.child("09").numChildren();
        var datas = snapshot.child("09").val();
      }else {
        var dataNum = snapshot.child(i+9).numChildren();
        var datas = snapshot.child(i+9).val();
      }
      if(datas != null){
        var getData = 0;
        if(datas["key"]!=null){
          for(let j=0;j < dataNum-1;j++){//date/time/*/count取得
            if(datas[j]!=null){
              getData += Number(datas[j].count);
            }
          }
        }else {
          for(let j=0;j < dataNum;j++){//date/time/*/count取得
            getData += Number(datas[j].count);
          }
        }
        console.log("total is "+getData);
        total.push(getData);
      }else {
        total.push(0);
      }
    }
    callback(total,item);
  });
}
//表示
function canvas(total,item) {
  //「時間別データ」
  var data = [
  { label: "09:00", y: total[0] },
  { label: "10:00", y: total[1] },
  { label: "11:00", y: total[2] },
  { label: "12:00", y: total[3] },
  { label: "13:00", y: total[4] },
  { label: "14:00", y: total[5] },
  { label: "15:00", y: total[6] },
  { label: "16:00", y: total[7] },
  { label: "17:00", y: total[8] }
  ];
  var stage = document.getElementById('stage'+item);
  var chart = new CanvasJS.Chart(stage, {
    title: {
      text: "売り上げ"  //グラフタイトル
    },
    theme: "theme4",  //テーマ設定
    data: [{
      type: 'column',  //グラフの種類
      dataPoints: data  //表示するデータ
    }]
  });
  chart.render();
}
history.js
function history(num,item) {
  console.log("print start"+item);
  var c=0;
  var database = firebase.database();
  var ref = new Firebase("https://kuji-1dd40.firebaseio.com/"+num+"/"+item+"/10/");//master消す
  for(let i=0;i<9;i++){
    ref.on("value", function(snapshot){
      if(i==0){
        var dataNum = snapshot.child("09").numChildren();
        var datas = snapshot.child("09").val();
      }else {
        var dataNum = snapshot.child(i+9).numChildren();
        var datas = snapshot.child(i+9).val();
      }
      console.log(datas);
      //console.log(snapshot.child(i+9).child("key").val());
      if(datas != null){
        if(datas["key"]!=null){
          for(let j = 0;j < dataNum-1;j++){
            if(datas[j]!=null){
              var time = document.createElement('p');
              time.id = ("time"+item+"_"+String(c));
              document.getElementById('wrapper'+item).appendChild(time);
              var count = document.createElement('p');
              count.id = ("count"+item+"_"+String(c));
              document.getElementById('wrapper'+item).appendChild(count);
              document.getElementById("time"+item+"_"+ String(c)).innerHTML = datas[j].time;
              document.getElementById("count"+item+"_"+ String(c)).innerHTML = datas[j].count;
              c++;
            }
          }
        }else {
          for(let j = 0;j < dataNum;j++){
            var time = document.createElement('p');
            time.id = ("time"+String(item)+"_"+String(c));
            document.getElementById('wrapper'+item).appendChild(time);
            var count = document.createElement('p');
            count.id = "count"+String(item)+"_"+String(c);
            document.getElementById('wrapper'+item).appendChild(count);
            document.getElementById("time"+item+"_" + String(c)).innerHTML = datas[j].time;
            document.getElementById("count"+item+"_" + String(c)).innerHTML = datas[j].count;
            c++;
          }
        }
      }

    });
  }
  console.log("print end");
}
説明
ハイ、読むの面倒だと思います。
簡単に説明します。
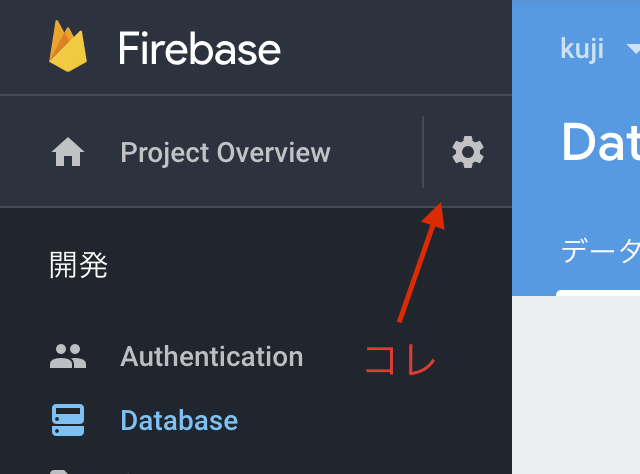
まずindex.htmlのInitialize Firebaseの部分でプロジェクトの定義をする。**ってとこは自分で設定してください。
overviewの右側にある設定マークで自分のapiキーとかはわかるはず。
その後dataTimeTotal(graph.js)で時間別の売り上げを算出し、canvas(graph.js)でグラフ化をしてる。
所々で見られるsnapshot.child()みたいなものでfirebaseからデータを取ってきてる。
ちなみにグラフ表示にはCanvasJsを使用した。
historyでは売り上げ履歴を表示してる。
おわりに
完成したはいいがコードの可読性が低かったりまだまだ問題が多いので修正が必要。
説明もかなり雑になってしまったのでまた別の機会に詳しく説明する記事を書こうと思う。
来年やるよって人が出てきたらもっと詳しく説明するよ。