はじめに
前回からの続きで、PyStan 3で結果の要約やのグラフ(Rstan教科書に出てくるやつ)の出し方のメモ。
Google Colab環境でpyStan 3.3を利用する
結論
ArviZを利用する。
※google colabに初めからインストール済。
※pyMC3, NumPyro など他のライブラリも対応。
ArviZ: Exploratory analysis of Bayesian models
# Pystan 3.5 Quick Start
import stan

schools_code = """
data {
  int<lower=0> J;         // number of schools
  real y[J];              // estimated treatment effects
  real<lower=0> sigma[J]; // standard error of effect estimates
}
parameters {
  real mu;                // population treatment effect
  real<lower=0> tau;      // standard deviation in treatment effects
  vector[J] eta;          // unscaled deviation from mu by school
}
transformed parameters {
  vector[J] theta = mu + tau * eta;        // school treatment effects
}
model {
  target += normal_lpdf(eta | 0, 1);       // prior log-density
  target += normal_lpdf(y | theta, sigma); // log-likelihood
}
"""

schools_data = {"J": 8,
                "y": [28,  8, -3,  7, -1,  1, 18, 12],
                "sigma": [15, 10, 16, 11,  9, 11, 10, 18]}

posterior = stan.build(schools_code, data=schools_data)
fit = posterior.sample(num_chains=4, num_samples=1000)
eta = fit["eta"]  # array with shape (8, 4000)
df = fit.to_frame()  # pandas `DataFrame, requires pandas
ここまでは前回まで動いたので、収束具合を確認します。
Arvizのデータ形式へ変換
# Arvizのデータ形式へ変換
import arviz as az
idata = az.from_pystan(posterior=fit, posterior_model=posterior)
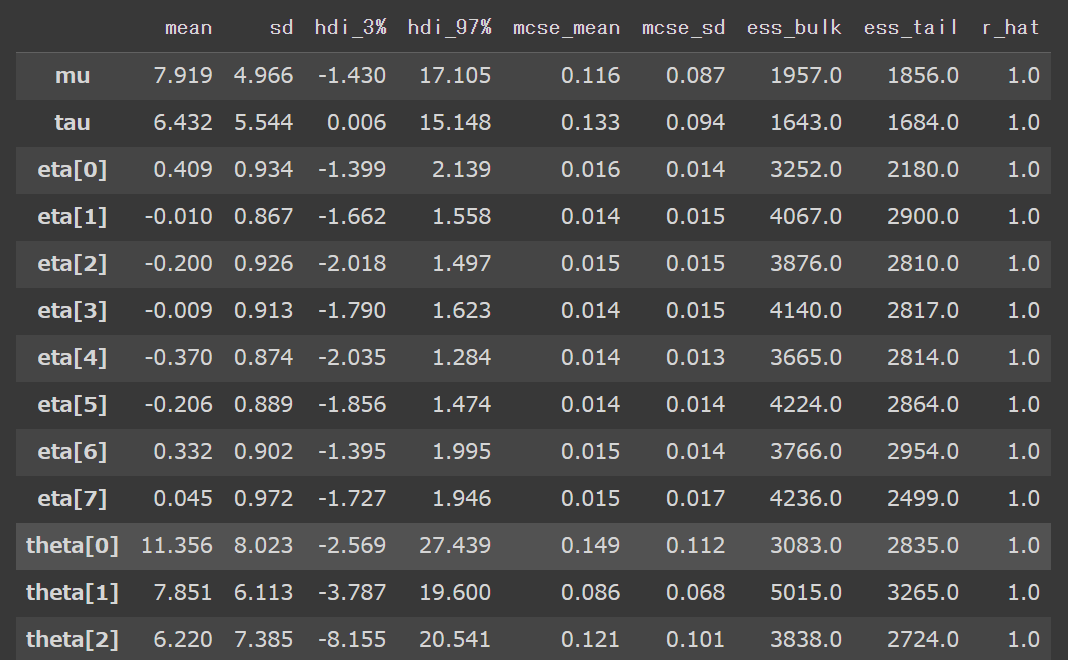
結果の要約表示 r_hatの値が1で収束しています。
az.summary(idata)
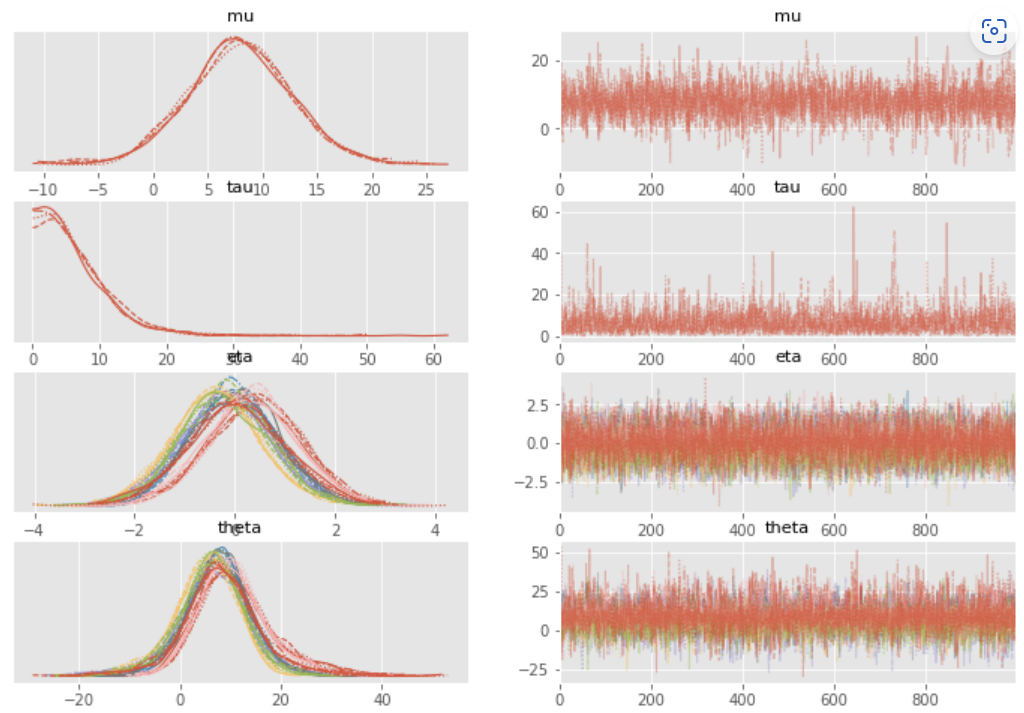
Trace Plot 交ざり具合を確認
az.plot_trace(idata)