basemap: pythonで簡単に地図をプロットする。データの可視化を地図上にしたいときにとても重宝します。
インストール。くそ面倒だったのが、めちゃ簡単になりました!
@mac
$ brew install geos
# $ pip install Pillow html5lib BeautifulSoup4
$ wget https://jaist.dl.sourceforge.net/project/matplotlib/matplotlib-toolkits/basemap-1.0.7/basemap-1.0.7.tar.gz
$ tar zxvf basemap-1.0.7.tar.gz
$ cd basemap-1.0.7
$ python setup.py install
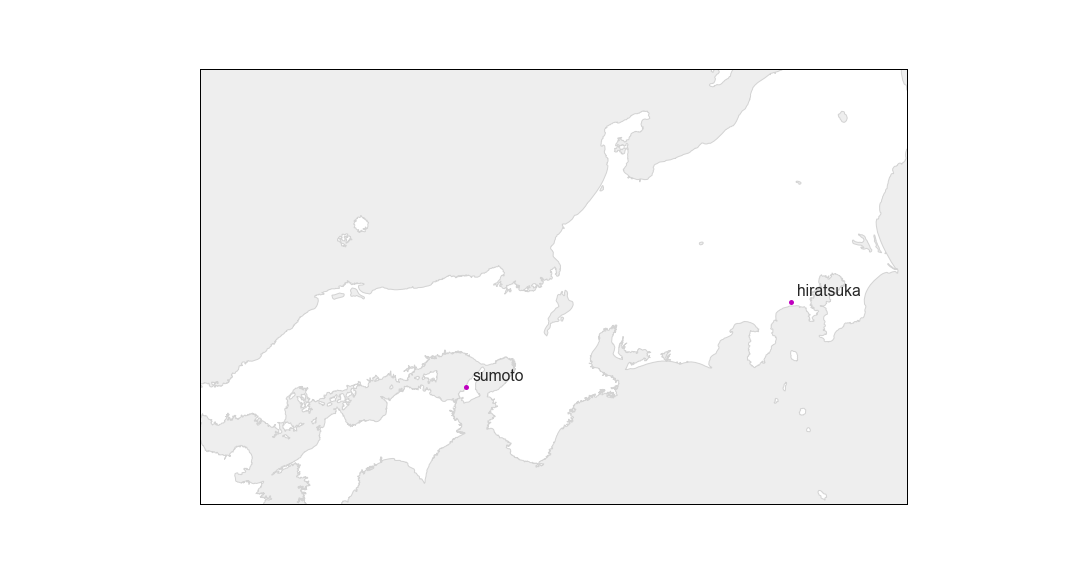
例: ラベル付きマップ
map.py
import numpy as np
import matplotlib.pyplot as plt
from mpl_toolkits.basemap import Basemap

fig = plt.figure(figsize=(8,4))
m = Basemap(projection='merc',
                 resolution='h',
                 llcrnrlon=131,
                 llcrnrlat=33,
                 urcrnrlon=141,
                 urcrnrlat=38)

m.drawcoastlines(color='lightgray')
m.drawcountries(color='lightgray')
m.fillcontinents(color='white', lake_color='#eeeeee');
m.drawmapboundary(fill_color='#eeeeee')
# m.drawparallels(np.arange(31.0, 38.1, 1.0), labels = [1,0,0,0], fontsize=12)
# m.drawmeridians(np.arange(132.0, 140.1, 2.0), labels = [0,0,0,1], fontsize=12)

sumoto_lon = 134.7687
sumoto_lat = 34.3755
hiratsuka_lon = 139.3581
hiratsuka_lat = 35.3587

x1,y1 = m(sumoto_lon, sumoto_lat)
x2,y2 = m(hiratsuka_lon, hiratsuka_lat)
m.plot(x1, y1, 'm.', markersize=10)
m.plot(x2, y2, 'm.', markersize=10)
plt.text(x1 + 10000, y1 + 10000, u"sumoto")
plt.text(x2 + 10000, y2 + 10000, u"hiratsuka")

plt.show()
fig.savefig('map.png')