概要
主成分分析(PCA, Principal Component Analysis) をクラスター分析と組み合わせて、高次の次元で定義されたデータを2次元空間データで表現する方法を、python3 で見ていく。また、類似のグループまたはクラスタのデータを検索し、データ内に隠れた関係を見つける。
キーワードの復習
PCAとは
PCAは主成分(principal component)を見つけることによってデータの次元を低下させる。
データセット元の特徴または変数を主成分に基づいて、縮小されたセットに変換することにより、データの分散を最大化するの最小の変数が得られます。
新しい変数が2つしかない場合、データ内の各サンプルを散布図などの2次元チャートで表すことができます。
クラスタリング
教師なしデータの分析技術として、クラスタリングは、その変数に基づいて「近接したデータサンプル」を編成する。
→各データが互いに「どのように関係しているのか」を理解し、同様のグループを発見可能。
→このグループまたはクラスタのそれぞれを取得すると、それらの重心(centroid)を定義可能。
重心(centroid)
重心は、クラスタ内の各データまでの距離の合計を最小にするデータサンプル。重心変数を分析することによって、各クラスタの特性を定義可能に。
1. データセットの準備
感染性結核の有病率に関するデータセットを使用。TB=Tuberculosis、結核
・Gapminderのウェブサイト。
TB estimated prevalence (existing cases) per 100K
・データセットは、各サンプル(国別データ)は18の異なる変数(1990年から2007年までの年別データ)。
・それぞれ1990年から2007年までの年間の10万人当たりの感染性結核の症例数(既存、新規、死亡)。
python 記述の前準備を行います。
# 基本のライブラリを読み込む
import numpy as np
import pandas as pd
from scipy import stats

# グラフ描画
from matplotlib import pylab as plt
import seaborn as sns
%matplotlib inline

# グラフを横長にする
from matplotlib.pylab import rcParams
rcParams['figure.figsize'] = 15, 6

import matplotlib as mpl
mpl.rcParams['font.family'] = ['serif']

url = 'https://docs.google.com/spreadsheets/d/1X5Jp7Q8pTs3KLJ5JBWKhncVACGsg5v4xu6badNs4C7I/pub?gid=0&output=csv'
existing_df = pd.read_csv(url,
    index_col = 0,
    thousands  = ',')
existing_df.index.names = ['country']
existing_df.columns.names = ['year']
dhead = existing_df.head()
print(dhead)
year            1990  1991  1992  1993  1994  1995  1996  1997  1998  1999  \
country
Afghanistan      436   429   422   415   407   397   397   387   374   373
Albania           42    40    41    42    42    43    42    44    43    42
Algeria           45    44    44    43    43    42    43    44    45    46
American Samoa    42    14     4    18    17    22     0    25    12     8
Andorra           39    37    35    33    32    30    28    23    24    22

year            2000  2001  2002  2003  2004  2005  2006  2007
country
Afghanistan      346   326   304   308   283   267   251   238
Albania           40    34    32    32    29    29    26    22
Algeria           48    49    50    51    52    53    55    56
American Samoa     8     6     5     6     9    11     9     5
Andorra           20    20    21    18    19    18    17    19
2. 主成分分析による次元削減
PCAを実行
まず、18の異なる変数(1990年から2007年までの年別データ)を各国、2次元空間で表現したい。PCAを使用することにより、これらの18の変数を、その情報を最もよく捕捉する2つの変数に減らす。
そのために、最初にPCAを実行する。
sklearn.decomposition.PCA
この実装では、特異値分解の scipy.linalg 実装を使用する。
密な配列でのみ機能し、大きな次元のデータにはスケーリングできない。
疎配列を使用している場合は numpy dense array
または sklearn.decomposition.SparsePCA
を参照。
このPCAの実装を使用する場合、使用する主成分の数を事前に指定する必要がある。
次に、fit() メソッドを呼び出し、結果を確認するだけ。
from sklearn.decomposition import PCA
pca = PCA(n_components=2)
pca.fit(existing_df)
主成分の確認
主成分はcomponents_に入っている。
ついでに平均と共分散行列はmean_, get_covariance()で見られる。
print("--- explained_variance_ratio_ ---")
print(pca.explained_variance_ratio_)
print("--- components ---")
print(pca.components_)
print("--- mean ---")
print(pca.mean_)
print("--- covariance ---")
print(pca.get_covariance())
--- explained_variance_ratio_ ---
[ 0.91808789  0.060556  ]
--- components ---
[[ 0.25583801  0.25470394  0.25141064  0.24772801  0.24449817  0.24141272
   0.2202353   0.21919471  0.2165391   0.22204506  0.22879832  0.23376061
   0.23077592  0.23574534  0.23472456  0.23435384  0.23355341  0.23217055]
 [ 0.33830021  0.31393233  0.29277268  0.26949215  0.23778166  0.20993393
   0.1208106   0.07301764  0.01743088 -0.05608852 -0.10059987 -0.16723358
  -0.20135595 -0.26801844 -0.27958111 -0.29766788 -0.29587202 -0.31605565]]
--- mean ---
[ 196.96618357  196.46859903  192.8115942   191.17391304  188.72463768
  187.94202899  178.89855072  180.97584541  178.12077295  180.47342995
  177.52173913  177.79710145  179.51690821  176.4057971   173.92270531
  171.18357488  169.01932367  167.25603865]
--- covariance ---
[[ 53732.64741829  52084.82476767  51141.11734954  50091.86097094
   48993.15076454  47982.20045345  42655.61242314  41707.77633366
データ変換
transform 呼出しで、データを変換出来る。
existing_2d = pca.transform(existing_df)

# fit_transform 呼出しで両方が同時に実行可能。
# existing_2d = pca.transform(existing_df)
existing_df_2d = pd.DataFrame(existing_2d)
existing_df_2d.index = existing_df.index
existing_df_2d.columns = ['PC1','PC2']
existing_df_2d.head()
| country | PC1 | PC2 |
|---|---|---|
| Afghanistan | -732.215864 | 203.381494 |
| Albania | 613.296510 | 4.715978 |
| Algeria | 569.303713 | -36.837051 |
| American Samoa | -717.082766 | 5.464696 |
| Andorra | -661.802241 | 11.037736 |
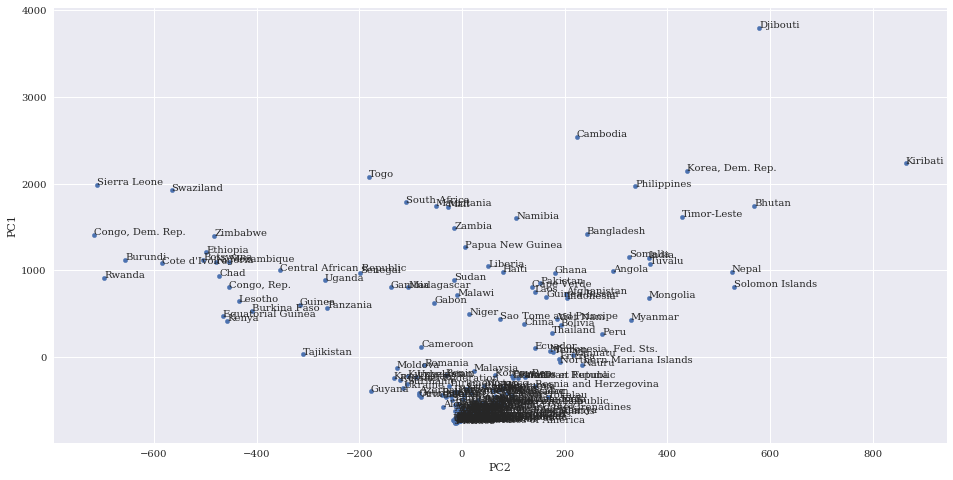
3. 主成分のグラフ表示
--- explained_variance_ratio_ ---
[ 0.91808789  0.060556  ]
最初の主成分はすでに分散の92%を説明していますが、
2番目の主成分は6%
→合計98%を二つの成分で表現できている。
x軸はPC2, y軸はPC1 としてデータフレームを作成。
また、各点に国名を付けるアノテーションを付与する。
ax = existing_df_2d.plot(kind='scatter', x='PC2', y='PC1', figsize=(16,8))
for i, country in enumerate(existing_df.index):
    ax.annotate(
        country,
       (existing_df_2d.iloc[i].PC2, existing_df_2d.iloc[i].PC1)
    )
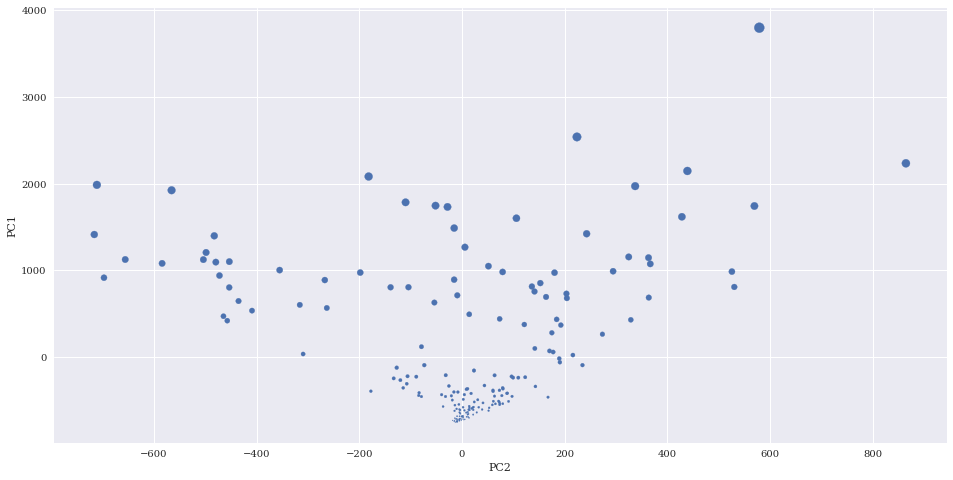
4. 平均値の追加
特定の国のすべての年の平均値に比例した値にポイントサイズを設定して、
バブルチャートを作成します。
まず、年ごとに国ごとのスケール変更された平均を含む新しい列を追加します。
from sklearn.preprocessing import normalize
existing_df_2d['country_mean'] = pd.Series(existing_df.mean(axis=1), index=existing_df_2d.index)
country_mean_max = existing_df_2d['country_mean'].max()
country_mean_min = existing_df_2d['country_mean'].min()
country_mean_scaled =
    (existing_df_2d.country_mean-country_mean_min) / country_mean_max
 existing_df_2d['country_mean_scaled'] = pd.Series(
    country_mean_scaled,
    index=existing_df_2d.index)

existing_df_2d.head()
| country | PC1 | PC2 | country_mean | country_mean_scaled |
|---|---|---|---|---|
| Afghanistan | 732.215864 | 203.381494 | 353.333333 | 0.329731 |
| Albania | -613.296510 | 4.715978 | 36.944444 | 0.032420 |
| Algeria | -569.303713 | -36.837051 | 47.388889 | 0.042234 |
| American Samoa | -717.082766 | 5.464696 | 12.277778 | 0.009240 |
| Andorra | -661.802241 | 11.037736 | 25.277778 | 0.021457 |
次に国名を省略して平均値をプロットサイズとして表示してみる。
existing_df_2d.plot(kind='scatter',
    x='PC2', y='PC1',
    s=existing_df_2d['country_mean_scaled']*100,
    figsize=(16,8))
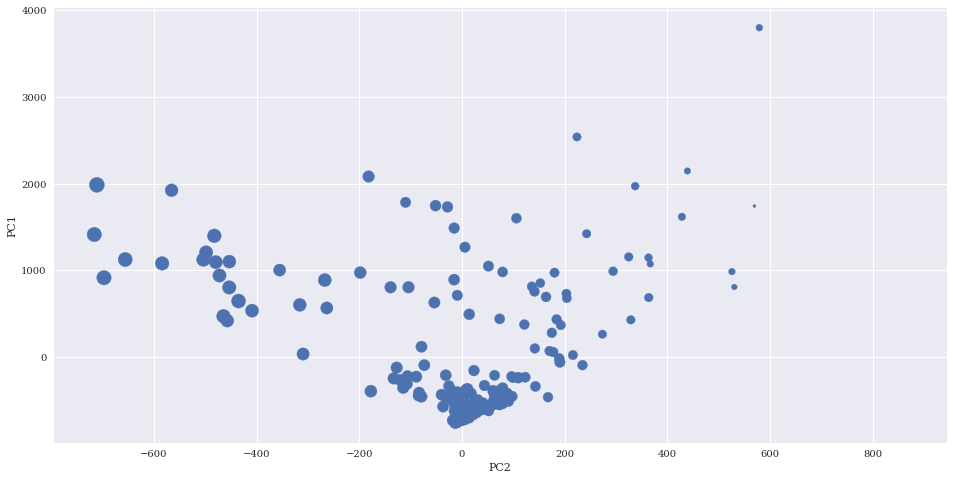
5. 合計値の追加
同様の考察を合計値で行います。
existing_df_2d['country_sum'] = pd.Series(
existing_df.sum(axis=1),
    index=existing_df_2d.index)
country_sum_max = existing_df_2d['country_sum'].max()
country_sum_min = existing_df_2d['country_sum'].min()
country_sum_scaled = (existing_df_2d.country_sum-country_sum_min) / country_sum_max
existing_df_2d['country_sum_scaled'] = pd.Series(
        country_sum_scaled,
        index=existing_df_2d.index)
existing_df_2d.plot(
    kind='scatter',
    x='PC2', y='PC1',
    s=existing_df_2d['country_sum_scaled']*100,
    figsize=(16,8))

6. 変化量の関連付け
最後に、1990年から2007年の間のデータ変化サイズを関連づけます。
スケールされたバージョンで0に近い値は、スケール前バージョンでは負の値に紐づく。スケール後の値域は[0,1]
existing_df_2d['country_change'] = pd.Series(
    existing_df['2007']-existing_df['1990'],
    index=existing_df_2d.index)
country_change_max = existing_df_2d['country_change'].max()
country_change_min = existing_df_2d['country_change'].min()
country_change_scaled = (existing_df_2d['country_change'] - country_change_min)/ country_change_max

existing_df_2d['country_change_scaled'] = pd.Series(
        country_change_scaled,
        index=existing_df_2d.index)
existing_df_2d[['country_change','country_change_scaled']].head()
| country | country_change | country_change_scaled |
|---|---|---|
| Afghanistan | -198 | 0.850840 |
| Albania | -20 | 1.224790 |
| Algeria | 11 | 1.289916 |
| American Samoa | -37 | 1.189076 |
| Andorra | -20 | 1.224790 |
プロットしてみる。
existing_df_2d.plot(
    kind='scatter',
    x='PC2', y='PC1',
    s=existing_df_2d['country_change_scaled']*100,
    figsize=(16,8))
7. 主成分分析の結果
主成分分析した結果をまとめると以下になります。
・PC1に割り当てたy軸に沿って最も変化が起きている。
・第一主成分で分散の92%を説明しており、第二主成分と98%を占める。
・チャートの一番上には、重要な国がプロット。ほとんどが先進国
・y軸の下方は疎な状態で開発途上国に属する。
・1990年から2007年の変化量を見ると、第2主成分の方向に沿ってほとんど変化し、
ケースの数の増量の差として表現されている。
↓
・第一主成分がデータの分散のほとんどを捉えているが
・1990年から2007年の範囲の合計に基づいた分散=第二主成分は時間の経過で大きく変化している。
次に国の間の他の関係性を見ていきます。
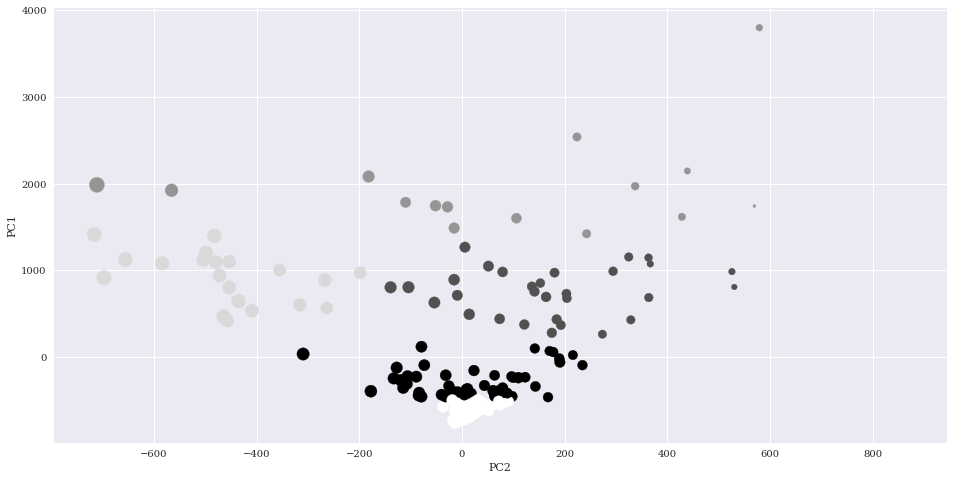
8. k-means によるクラスタリング
次にk-meansクラスタリングを使用して、状況が年々どのように類似しているかに基づいて国をグループ化します。
・18の変数に基づいてデータをクラスター化し、
・データ内の隠れた関係を発見し、
・結核病に関する世界の状況をよりよく理解するために、クラスター割り当てを2Dチャートに色付けする。
sklearn を使用して、TBデータのクラスタリングを実行する。
クラスター数は5つとする。
クラスターラベルは clusters.labels_で返されるので、クラスター割り当てを
データフレームに格納する。
from sklearn.cluster import KMeans
kmeans = KMeans(n_clusters=5)
clusters = kmeans.fit(existing_df)

existing_df_2d['cluster'] = pd.Series(clusters.labels_, index=existing_df_2d.index)
プロットしてみる。
import numpy as np

existing_df_2d.plot(
        kind='scatter',
        x='PC2',y='PC1',
        c=existing_df_2d.cluster.astype(np.float),
        s=existing_df_2d['country_change_scaled']*100,
        figsize=(16,8))
9. クラスタリング結果の考察
各クラスタを分析するために、クラスタIDを含むデータフレームに列を追加しましょう。サブセット化に使用します。
9-1. クラスターのサンプル数の分布
クラスターの分布を確認します。
existing_df_2d['cluster'].value_counts()
4    90
0    51
3    30
1    20
2    16
Name: cluster, dtype: int64
9-2. クラスターの重心の変動確認
クラスターの重心の変動を確認します。
df = clusters.cluster_centers_
df
array([[ 130.60784314,  133.41176471,  125.60784314,  127.54901961,
         124.82352941,  127.70588235,  121.68627451,  130.50980392,
         125.82352941,  124.45098039,  110.58823529,  106.60784314,
         121.09803922,  103.01960784,  101.80392157,   97.29411765,
          96.17647059,   91.68627451],
       [ 259.85      ,  278.9       ,  287.3       ,  298.05      ,
         309.        ,  322.95      ,  335.        ,  357.65      ,
         369.65      ,  410.85      ,  422.25      ,  463.75      ,
         492.45      ,  525.25      ,  523.6       ,  519.9       ,
         509.8       ,  513.5       ],
       [ 764.        ,  751.1875    ,  734.9375    ,  718.0625    ,
         701.6875    ,  687.3125    ,  624.75      ,  621.625     ,
         605.1875    ,  609.4375    ,  622.        ,  635.5       ,
         604.25      ,  601.125     ,  597.375     ,  601.125     ,
         600.25      ,  595.75      ],
       [ 444.5       ,  435.2       ,  426.16666667,  417.4       ,
         409.23333333,  400.56666667,  378.6       ,  365.36666667,
         358.03333333,  354.43333333,  350.6       ,  326.73333333,
         316.16666667,  308.5       ,  297.86666667,  288.8       ,
         284.96666667,  280.8       ],
       [  37.27777778,   35.68888889,   35.73333333,   34.4       ,
          33.51111111,   32.42222222,   30.8       ,   30.51111111,
          29.3       ,   26.77777778,   24.35555556,   23.57777778,
          22.02222222,   20.93333333,   20.48888889,   19.92222222,
          19.25555556,   19.11111111]])
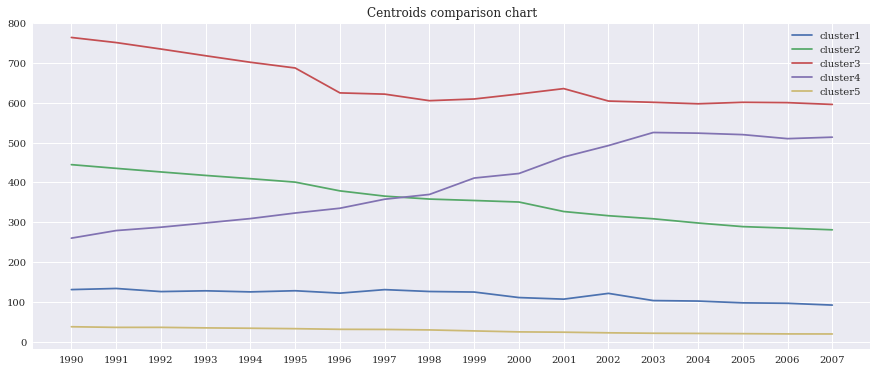
重心の変動をプロットします。
x = np.arange(1990, 2008)
fig, ax = plt.subplots()
for cl in range(0,5):
    ax.plot(x, np.array((df.T)[cl]), label='cluster'+str(cl))

plt.title('Centroids comparison chart')
ax.set_xticks(x)
ax.set_xticklabels(x)
plt.legend(loc='best')
Cluster 1
クラスター1には51ヶ国が含まれる。
existing_df_2d[existing_df_2d['cluster']==0]
C1	PC2	country_mean	country_mean_scaled	country_sum	country_sum_scaled	country_change	country_change_scaled	cluster
country
Armenia	-454.552060	-78.986374	74.944444	0.068128	1349	0.068128	29	1.327731	0
Azerbaijan	-410.215266	-83.510757	85.611111	0.078152	1541	0.078152	28	1.325630	0
Bahrain	-443.480516	77.585555	76.388889	0.069486	1375	0.069486	-60	1.140756	0
Belarus	-432.631571	-39.693354	80.333333	0.073192	1446	0.073192	7	1.281513	0
Benin	-208.237408	-31.658052	132.444444	0.122161	2384	0.122161	-5	1.256303	0
Bosnia and Herzegovina	-337.633139	142.997336	100.944444	0.092561	1817	0.092561	-105	1.046218	0
Brazil	-394.477560	60.513236	88.055556	0.080449	1585	0.080449	-64	1.132353	0
重心の変動はこちら。
df[0]
array([ 130.60784314,  133.41176471,  125.60784314,  127.54901961,
        124.82352941,  127.70588235,  121.68627451,  130.50980392,
        125.82352941,  124.45098039,  110.58823529,  106.60784314,
        121.09803922,  103.01960784,  101.80392157,   97.29411765,
         96.17647059,   91.68627451])
・このクラスターには多くのアメリカ大陸の国と一部のヨーロッパ諸国が属する。
・一部の国はロシアやブラジルのように大きく豊か。
・患者数は減少傾向。
Cluster 2
クラスター2には30ヶ国が含まれる。
existing_df_2d[existing_df_2d['cluster']==1]
PC1	PC2	country_mean	country_mean_scaled	country_sum	country_sum_scaled	country_change	country_change_scaled	cluster
country
Botswana	1124.623706	-503.640618	448.166667	0.418846	8067	0.418846	278	1.850840	1
Burkina Faso	536.374072	-408.919486	310.166667	0.289167	5583	0.289167	224	1.737395	1
Burundi	1125.814696	-655.801897	449.833333	0.420412	8097	0.420412	359	2.021008	1
Central African Republic	1003.717739	-355.104319	419.833333	0.392221	7557	0.392221	107	1.491597	1
Chad	940.992223	-472.269062	406.444444	0.379640	7316	0.379640	246	1.783613	1
Congo, Rep.	803.678138	-453.276487	375.277778	0.350352	6755	0.350352	276	1.846639	1
重心の変動はこちら。
df[1]
array([ 444.5       ,  435.2       ,  426.16666667,  417.4       ,
        409.23333333,  400.56666667,  378.6       ,  365.36666667,
        358.03333333,  354.43333333,  350.6       ,  326.73333333,
        316.16666667,  308.5       ,  297.86666667,  288.8       ,
        284.96666667,  280.8       ])
・このクラスターは症例数が年々増加している唯一のクラスター。
・症例数が最多の第三クラスターを追い越す勢い。
→これらの各国は人道危機の中にあり、おそらくHIVのような他の感染症にかかっている。
Cluster 3
クラスター3には16ヶ国が含まれる。
existing_df_2d[existing_df_2d['cluster']==2]
PC1	PC2	country_mean	country_mean_scaled	country_sum	country_sum_scaled	country_change	country_change_scaled	cluster
country
Bangladesh	1422.800603	242.722083	515.444444	0.482067	9278	0.482067	-252	0.737395	2
Bhutan	1742.709249	569.448954	587.722222	0.549987	10579	0.549987	-561	0.088235	2
Cambodia	2538.953258	223.864004	778.611111	0.729366	14015	0.729366	-264	0.712185	2
Korea, Dem. Rep.	2146.623299	438.945977	686.611111	0.642913	12359	0.642913	-400	0.426471	2
Djibouti	3798.447446	578.975277	1064.166667	0.997703	19155	0.997703	-381	0.466387	2
Kiribati	2234.809790	864.494075	702.888889	0.658209	12652	0.658209	-603	0.000000	2
Mali	1732.257902	-28.197847	589.500000	0.551658	10611	0.551658	-41	1.180672	2
重心の変動はこちら。
df[2]
array([ 764.    ,  751.1875,  734.9375,  718.0625,  701.6875,  687.3125,
        624.75  ,  621.625 ,  605.1875,  609.4375,  622.    ,  635.5   ,
        604.25  ,  601.125 ,  597.375 ,  601.125 ,  600.25  ,  595.75  ])
・このクラスターは、症例数は徐々に減少しているが、毎年最も結核が多い国々。
Cluster 4
クラスター4には20ヶ国が含まれる。
existing_df_2d[existing_df_2d['cluster']==3]
PC1	PC2	country_mean	country_mean_scaled	country_sum	country_sum_scaled	country_change	country_change_scaled	cluster
country
Botswana	1124.623706	-503.640618	448.166667	0.418846	8067	0.418846	278	1.850840	3
Burkina Faso	536.374072	-408.919486	310.166667	0.289167	5583	0.289167	224	1.737395	3
Burundi	1125.814696	-655.801897	449.833333	0.420412	8097	0.420412	359	2.021008	3
Central African Republic	1003.717739	-355.104319	419.833333	0.392221	7557	0.392221	107	1.491597	3
Chad	940.992223	-472.269062	406.444444	0.379640	7316	0.379640	246	1.783613	3
重心の変動はこちら。
df[3]
array([ 259.85,  278.9 ,  287.3 ,  298.05,  309.  ,  322.95,  335.  ,
        357.65,  369.65,  410.85,  422.25,  463.75,  492.45,  525.25,
        523.6 ,  519.9 ,  509.8 ,  513.5 ])
・インドや中国などが含まれ、症例が最も減少しているクラスター。
Cluster 5
クラスター5には最大の90ヶ国が含まれる。
existing_df_2d[existing_df_2d['cluster']==4]
PC1	PC2	country_mean	country_mean_scaled	country_sum	country_sum_scaled	country_change	country_change_scaled	cluster
country
Albania	-613.296510	4.715978	36.944444	0.032420	665	0.032420	-20	1.224790	4
Algeria	-569.303713	-36.837051	47.388889	0.042234	853	0.042234	11	1.289916	4
American Samoa	-717.082766	5.464696	12.277778	0.009240	221	0.009240	-37	1.189076	4
Andorra	-661.802241	11.037736	25.277778	0.021457	455	0.021457	-20	1.224790	4
Anguilla	-618.891169	-14.502928	35.611111	0.031167	641	0.031167	-4	1.258403	4
重心の変動はこちら。
df[4]
array([ 37.27777778,  35.68888889,  35.73333333,  34.4       ,
        33.51111111,  32.42222222,  30.8       ,  30.51111111,
        29.3       ,  26.77777778,  24.35555556,  23.57777778,
        22.02222222,  20.93333333,  20.48888889,  19.92222222,
        19.25555556,  19.11111111])
・結核発症数がもっとも少ないクラスター。
・ちなみに日本もここに属する。
・このクラスタは大きすぎて異質なものが含まれるので、おそらくさらなる洗練が必要。
10. 第二階層のクラスタリング
クラスター5の90カ国を再調整して、それを改良します。
クラスター5を持つ2つの異なるクラスタがあるかどうかを調べる。
# datasetcluster5_df  クラスター5のみに絞ったデータセット
existing_df['cluster'] = pd.Series(clusters.labels_, index=existing_df.index)
datasetcluster5_df = existing_df[existing_df['cluster']==4]

# k-meansで二つに分類してみる
kmeans2 = KMeans(n_clusters=2)
cluster5_clustering = kmeans2.fit(datasetcluster5_df)

# 主成分1、主成分2と平均、合計の集計値のクラスター5のみの集計値
existing_cl5_df_2d = existing_df_2d[existing_df_2d['cluster'] == 4]

# 主成分1、主成分2と平均、合計の集計値のクラスター5のみの集計値
#  + 二段階目のクラスタリング結果(cluster5=0,1)付与
df_label = pd.DataFrame(cluster5_clustering.labels_, index=existing_cl5_df_2d.index)
df_label.columns = ['cluster5']

datasetcluster5_df = pd.concat([existing_cl5_df_2d, df_label], axis=1)
クラスタリングの内訳を確認。クラスタ5-1->12ヶ国 クラスタ5-2->39ヶ国
datasetcluster5_df['cluster5'].value_counts()
1    39
0    12
二段階目のクラスタリングしたさいの重心値を確認します。
# 二段階目のクラスタリングしたさいの重心値
df2 = cluster5_clustering.cluster_centers_
print(df2)
[[ 62.51282051  60.38461538  60.51282051  58.33333333  57.41025641
   56.02564103  53.92307692  53.53846154  52.25641026  46.28205128
   41.87179487  40.1025641   37.35897436  35.58974359  34.43589744
   33.38461538  32.1025641   31.69230769   4.        ]
 [ 17.98039216  16.80392157  16.78431373  16.09803922  15.23529412
   14.37254902  13.11764706  12.90196078  11.74509804  11.8627451
   10.96078431  10.94117647  10.29411765   9.7254902    9.82352941
    9.62745098   9.43137255   9.49019608   4.        ]]
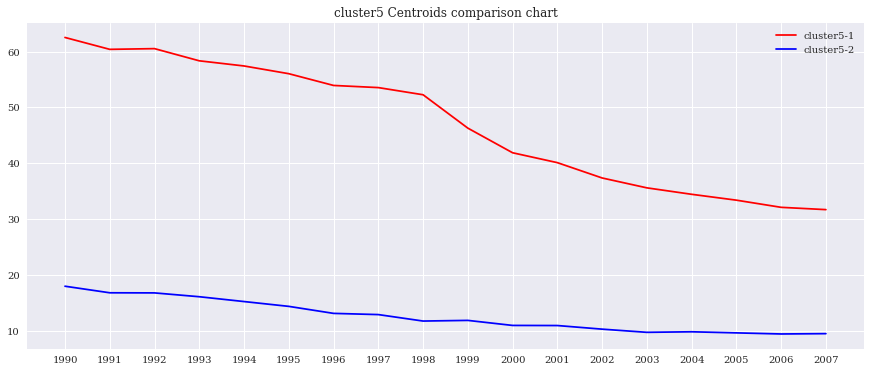
グラフ表示します。
# 二段階目のクラスタリングしたさいの重心値のグラフ表示
x = np.arange(1990, 2008)
fig, ax = plt.subplots()

ax.plot(x, df2[0,0:18], label='cluster5-1', color='r')
ax.plot(x, df2[1,0:18], label='cluster5-2', color='b')
ax.set_xticks(x)
ax.set_xticklabels(x)
plt.title('cluster5 Centroids comparison chart')
plt.legend(loc='best')
cluster5-1 の国データ
print(datasetcluster5_df[datasetcluster5_df['cluster5']==0])
PC1 PC2 country_mean \
country
Albania -613.296510 4.715978 36.944444
Algeria -569.303713 -36.837051 47.388889
Anguilla -618.891169 -14.502928 35.611111
Argentina -508.244158 61.039700 61.222222
Bahamas -553.237930 -13.787740 51.111111
Belize -565.111003 14.060593 48.000000
Bulgaria -544.874902 -6.043780 53.333333
Colombia -491.294650 30.672246 65.388889
Egypt -604.766469 12.869140 38.888889
Estonia -486.642717 2.547315 67.444444
Fiji -577.491692 32.590530 45.055556
French Polynesia -538.327109 65.059580 54.111111
Hungary -550.051871 59.069591 51.666667
Iran -583.649125 20.700250 43.833333
Japan -575.471511 22.452438 45.666667
Kuwait -549.008743 73.316704 51.555556
Lebanon -584.210391 52.863033 43.500000
Libyan Arab Jamahiriya -637.258610 28.758170 31.055556
Mauritius -577.529300 2.119333 45.388889
Mexico -536.601261 79.361134 54.333333
New Caledonia -509.920839 90.671594 60.833333
Panama -516.562737 23.861280 59.611111
Poland -517.304449 72.550523 59.111111
Portugal -609.760971 14.634392 37.611111
Saint Vincent and the Grenadines -602.640255 -4.965296 39.388889
Samoa -636.335973 -4.767621 31.555556
Saudi Arabia -494.961703 -18.887746 65.055556
Singapore -592.589355 19.064797 41.722222
Slovakia -603.550388 39.232083 38.888889
Slovenia -617.048901 51.784965 35.500000
Spain -639.083826 8.167293 30.666667
Syrian Arab Republic -535.090261 73.562807 54.777778
Macedonia, FYR -507.156160 71.197521 61.555556
Tonga -609.369034 -3.622569 37.722222
Tunisia -607.890704 21.930937 38.055556
Turkey -527.535546 40.886979 56.833333
United Arab Emirates -633.122426 11.348692 32.055556
Venezuela -596.326691 -10.524193 40.888889
West Bank and Gaza -585.225414 14.463482 43.388889
country_mean_scaled country_sum \
country
Albania 0.032420 665
Algeria 0.042234 853
Anguilla 0.031167 641
Argentina 0.055234 1102
Bahamas 0.045732 920
Belize 0.042809 864
Bulgaria 0.047820 960
Colombia 0.059149 1177
Egypt 0.034247 700
Estonia 0.061081 1214
Fiji 0.040042 811
French Polynesia 0.048551 974
Hungary 0.046254 930
Iran 0.038893 789
Japan 0.040616 822
Kuwait 0.046150 928
Lebanon 0.038580 783
Libyan Arab Jamahiriya 0.026886 559
Mauritius 0.040355 817
Mexico 0.048760 978
New Caledonia 0.054868 1095
Panama 0.053720 1073
Poland 0.053250 1064
Portugal 0.033046 677
Saint Vincent and the Grenadines 0.034717 709
Samoa 0.027356 568
Saudi Arabia 0.058836 1171
Singapore 0.036909 751
Slovakia 0.034247 700
Slovenia 0.031062 639
Spain 0.026520 552
Syrian Arab Republic 0.049178 986
Macedonia, FYR 0.055547 1108
Tonga 0.033151 679
Tunisia 0.033464 685
Turkey 0.051109 1023
United Arab Emirates 0.027826 577
Venezuela 0.036126 736
West Bank and Gaza 0.038476 781
country_sum_scaled country_change \
country
Albania 0.032420 -20
Algeria 0.042234 11
Anguilla 0.031167 -4
Argentina 0.055234 -61
Bahamas 0.045732 -3
Belize 0.042809 -19
Bulgaria 0.047820 -2
Colombia 0.059149 -45
Egypt 0.034247 -21
Estonia 0.061081 -11
Fiji 0.040042 -38
French Polynesia 0.048551 -35
Hungary 0.046254 -48
Iran 0.038893 -23
Japan 0.040616 -34
Kuwait 0.046150 -64
Lebanon 0.038580 -41
Libyan Arab Jamahiriya 0.026886 -29
Mauritius 0.040355 -14
Mexico 0.048760 -78
New Caledonia 0.054868 -87
Panama 0.053720 -29
Poland 0.053250 -60
Portugal 0.033046 -28
Saint Vincent and the Grenadines 0.034717 -6
Samoa 0.027356 -11
Saudi Arabia 0.058836 -3
Singapore 0.036909 -25
Slovakia 0.034247 -35
Slovenia 0.031062 -51
Spain 0.026520 -21
Syrian Arab Republic 0.049178 -67
Macedonia, FYR 0.055547 -59
Tonga 0.033151 -17
Tunisia 0.033464 -21
Turkey 0.051109 -49
United Arab Emirates 0.027826 -23
Venezuela 0.036126 -7
West Bank and Gaza 0.038476 -24
country_change_scaled cluster cluster5
country
Albania 1.224790 4 0
Algeria 1.289916 4 0
Anguilla 1.258403 4 0
Argentina 1.138655 4 0
Bahamas 1.260504 4 0
Belize 1.226891 4 0
Bulgaria 1.262605 4 0
Colombia 1.172269 4 0
Egypt 1.222689 4 0
Estonia 1.243697 4 0
Fiji 1.186975 4 0
French Polynesia 1.193277 4 0
Hungary 1.165966 4 0
Iran 1.218487 4 0
Japan 1.195378 4 0
Kuwait 1.132353 4 0
Lebanon 1.180672 4 0
Libyan Arab Jamahiriya 1.205882 4 0
Mauritius 1.237395 4 0
Mexico 1.102941 4 0
New Caledonia 1.084034 4 0
Panama 1.205882 4 0
Poland 1.140756 4 0
Portugal 1.207983 4 0
Saint Vincent and the Grenadines 1.254202 4 0
Samoa 1.243697 4 0
Saudi Arabia 1.260504 4 0
Singapore 1.214286 4 0
Slovakia 1.193277 4 0
Slovenia 1.159664 4 0
Spain 1.222689 4 0
Syrian Arab Republic 1.126050 4 0
Macedonia, FYR 1.142857 4 0
Tonga 1.231092 4 0
Tunisia 1.222689 4 0
Turkey 1.163866 4 0
United Arab Emirates 1.218487 4 0
Venezuela 1.252101 4 0
West Bank and Gaza 1.216387 4 0
In [90]:
cluster5-2 の国データ
print(datasetcluster5_df[datasetcluster5_df['cluster5']==1])
PC1 PC2 country_mean \
country
American Samoa -717.082766 5.464696 12.277778
Andorra -661.802241 11.037736 25.277778
Antigua and Barbuda -723.656796 -5.371258 10.833333
Australia -742.575408 -13.748824 6.444444
Austria -715.906806 -5.969220 12.666667
Barbados -747.393482 -9.335381 5.277778
Belgium -715.779552 -8.732092 12.722222
Bermuda -738.452782 -10.165310 7.388889
British Virgin Islands -679.056460 2.317492 21.277778
Canada -748.125458 -11.062861 5.111111
Cayman Islands -739.387791 -9.104772 7.166667
Chile -662.228202 21.763156 25.111111
Cook Islands -684.975871 0.804587 19.833333
Costa Rica -687.115904 9.091935 19.388889
Cuba -699.469036 13.694036 16.388889
Cyprus -731.203770 -4.776154 9.055556
Czech Republic -698.079517 2.354928 16.888889
Denmark -734.123360 -8.450219 8.388889
Dominica -681.341369 -9.558557 20.833333
Finland -733.692864 -5.920810 8.500000
France -707.586764 -3.694539 14.611111
Germany -727.213838 -1.375587 10.000000
Greece -679.908327 0.579360 21.111111
Grenada -740.505112 -15.397810 6.944444
Iceland -756.172711 -12.528394 3.222222
Ireland -714.607224 -4.601586 12.944444
Israel -737.250735 -9.446258 7.666667
Italy -737.016263 -9.544235 7.722222
Jamaica -736.272078 -11.174943 7.888889
Jordan -714.081886 -0.278622 13.111111
Luxembourg -714.692522 -4.300425 12.944444
Malta -741.488223 -9.337257 6.666667
Monaco -759.525361 -13.312820 2.444444
Montserrat -716.398537 -11.342383 12.611111
Netherlands -737.250735 -9.446258 7.666667
Netherlands Antilles -685.794345 -0.190404 19.722222
New Zealand -728.548793 -14.694878 9.777778
Norway -745.515028 -10.035931 5.722222
Oman -689.165040 12.079677 18.722222
Puerto Rico -720.978275 3.725904 11.444444
Saint Kitts and Nevis -708.715480 -11.252255 14.388889
Saint Lucia -682.010832 -4.606776 20.611111
San Marino -742.009194 -10.407468 6.555556
Sweden -750.538270 -13.357630 4.555556
Switzerland -734.485066 -4.565830 8.277778
Trinidad and Tobago -703.442301 -13.952061 15.666667
Turks and Caicos Islands -654.673434 12.329310 26.944444
United Kingdom -729.196030 -18.052449 9.611111
Virgin Islands (U.S.) -682.788717 -0.402710 20.388889
United States of America -749.043141 -9.326693 4.888889
Uruguay -650.562152 -3.484980 28.055556
country_mean_scaled country_sum \
country
American Samoa 0.009240 221
Andorra 0.021457 455
Antigua and Barbuda 0.007883 195
Australia 0.003759 116
Austria 0.009606 228
Barbados 0.002662 95
Belgium 0.009658 229
Bermuda 0.004646 133
British Virgin Islands 0.017698 383
Canada 0.002506 92
Cayman Islands 0.004437 129
Chile 0.021300 452
Cook Islands 0.016340 357
Costa Rica 0.015923 349
Cuba 0.013104 295
Cyprus 0.006212 163
Czech Republic 0.013573 304
Denmark 0.005586 151
Dominica 0.017280 375
Finland 0.005690 153
France 0.011433 263
Germany 0.007100 180
Greece 0.017541 380
Grenada 0.004229 125
Iceland 0.000731 58
Ireland 0.009867 233
Israel 0.004907 138
Italy 0.004960 139
Jamaica 0.005116 142
Jordan 0.010023 236
Luxembourg 0.009867 233
Malta 0.003968 120
Monaco 0.000000 44
Montserrat 0.009554 227
Netherlands 0.004907 138
Netherlands Antilles 0.016236 355
New Zealand 0.006891 176
Norway 0.003080 103
Oman 0.015296 337
Puerto Rico 0.008457 206
Saint Kitts and Nevis 0.011224 259
Saint Lucia 0.017071 371
San Marino 0.003863 118
Sweden 0.001984 82
Switzerland 0.005482 149
Trinidad and Tobago 0.012425 282
Turks and Caicos Islands 0.023023 485
United Kingdom 0.006735 173
Virgin Islands (U.S.) 0.016862 367
United States of America 0.002297 88
Uruguay 0.024067 505
country_sum_scaled country_change \
country
American Samoa 0.009240 -37
Andorra 0.021457 -20
Antigua and Barbuda 0.007883 -7
Australia 0.003759 -1
Austria 0.009606 -8
Barbados 0.002662 -5
Belgium 0.009658 -7
Bermuda 0.004646 -4
British Virgin Islands 0.017698 -16
Canada 0.002506 -3
Cayman Islands 0.004437 -5
Chile 0.021300 -33
Cook Islands 0.016340 31
Costa Rica 0.015923 -19
Cuba 0.013104 -25
Cyprus 0.006212 -8
Czech Republic 0.013573 -13
Denmark 0.005586 -6
Dominica 0.017280 -5
Finland 0.005690 -9
France 0.011433 -10
Germany 0.007100 -10
Greece 0.017541 -14
Grenada 0.004229 -1
Iceland 0.000731 -2
Ireland 0.009867 -8
Israel 0.004907 -5
Italy 0.004960 -5
Jamaica 0.005116 -3
Jordan 0.010023 -10
Luxembourg 0.009867 -10
Malta 0.003968 -5
Monaco 0.000000 -1
Montserrat 0.009554 -6
Netherlands 0.004907 -5
Netherlands Antilles 0.016236 -13
New Zealand 0.006891 -3
Norway 0.003080 -4
Oman 0.015296 -26
Puerto Rico 0.008457 -12
Saint Kitts and Nevis 0.011224 -5
Saint Lucia 0.017071 -8
San Marino 0.003863 -4
Sweden 0.001984 0
Switzerland 0.005482 -9
Trinidad and Tobago 0.012425 -2
Turks and Caicos Islands 0.023023 -25
United Kingdom 0.006735 3
Virgin Islands (U.S.) 0.016862 -14
United States of America 0.002297 -4
Uruguay 0.024067 -12
country_change_scaled cluster cluster5
country
American Samoa 1.189076 4 1
Andorra 1.224790 4 1
Antigua and Barbuda 1.252101 4 1
Australia 1.264706 4 1
Austria 1.250000 4 1
Barbados 1.256303 4 1
Belgium 1.252101 4 1
Bermuda 1.258403 4 1
British Virgin Islands 1.233193 4 1
Canada 1.260504 4 1
Cayman Islands 1.256303 4 1
Chile 1.197479 4 1
Cook Islands 1.331933 4 1
Costa Rica 1.226891 4 1
Cuba 1.214286 4 1
Cyprus 1.250000 4 1
Czech Republic 1.239496 4 1
Denmark 1.254202 4 1
Dominica 1.256303 4 1
Finland 1.247899 4 1
France 1.245798 4 1
Germany 1.245798 4 1
Greece 1.237395 4 1
Grenada 1.264706 4 1
Iceland 1.262605 4 1
Ireland 1.250000 4 1
Israel 1.256303 4 1
Italy 1.256303 4 1
Jamaica 1.260504 4 1
Jordan 1.245798 4 1
Luxembourg 1.245798 4 1
Malta 1.256303 4 1
Monaco 1.264706 4 1
Montserrat 1.254202 4 1
Netherlands 1.256303 4 1
Netherlands Antilles 1.239496 4 1
New Zealand 1.260504 4 1
Norway 1.258403 4 1
Oman 1.212185 4 1
Puerto Rico 1.241597 4 1
Saint Kitts and Nevis 1.256303 4 1
Saint Lucia 1.250000 4 1
San Marino 1.258403 4 1
Sweden 1.266807 4 1
Switzerland 1.247899 4 1
Trinidad and Tobago 1.262605 4 1
Turks and Caicos Islands 1.214286 4 1
United Kingdom 1.273109 4 1
Virgin Islands (U.S.) 1.237395 4 1
United States of America 1.258403 4 1
Uruguay 1.241597 4 1
・5−1のクラスターは相対的に結核発症数が多いグループ。全体として大きく減少している。
・5-2のクラスターは相対的に結核発症数が少ないグループ。
・ちなみに日本は5−1のクラスターに属する。
11. 結論
PCAとk-meansクラスタリングに関して
・PCA
まず18年間の症例数の増減に基づいて、2次元空間にすべての国の分布をプロットした。
それにより、症例の総数が主成分、時間の変化の割合が第2の成分で表現した。
・k-means クラスタリング
次に、k-meansクラスタリングを使用して、各年のケース数がどれほど類似しているかに
よって国をグループ化した。
時間の経過に伴ってほとんどの国がどのように改善したかが見て取れるが、
症例数を増やしている疾病の蔓延率の高い国のグループも発見した。
今回の解析notebook
今回の詳細データ解析過程については github を参照してください。