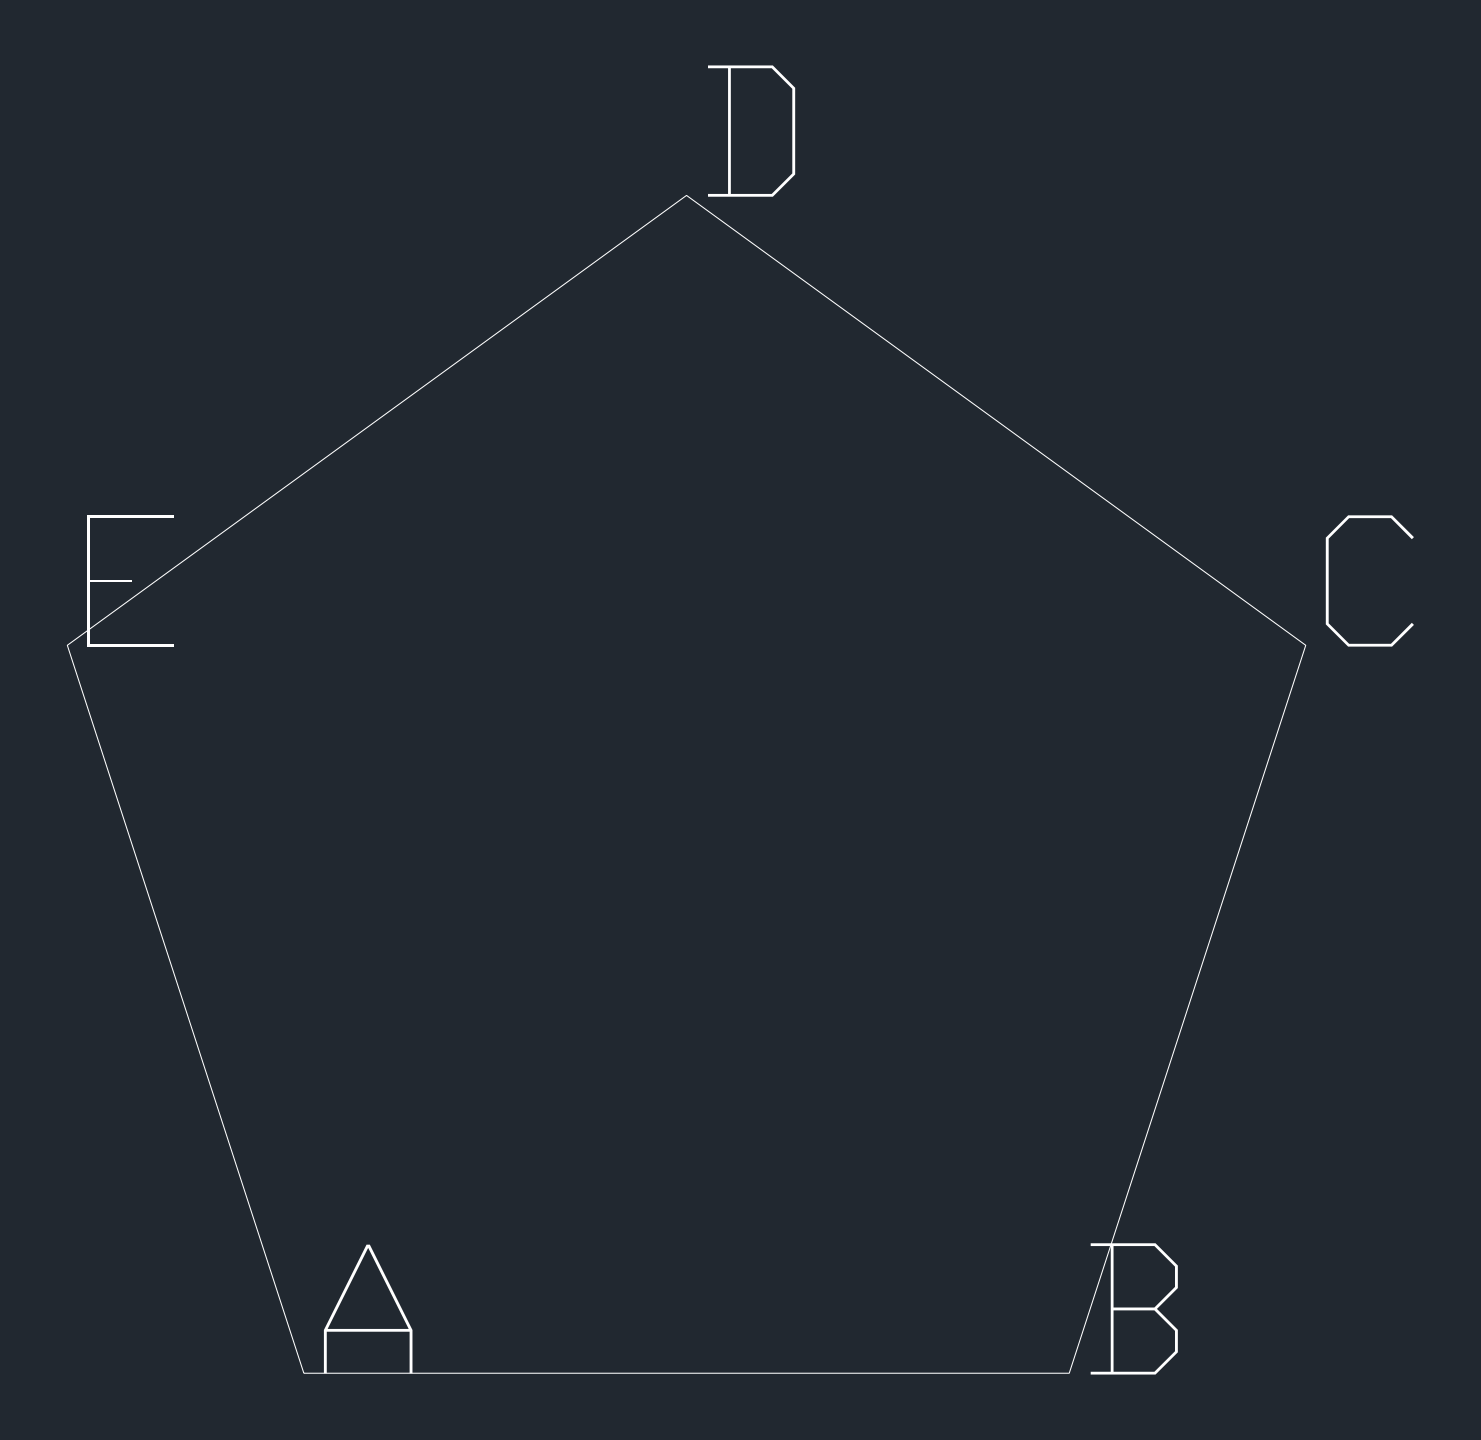
ソースは、約300行長文です。
正五角形のみです。
pythonで(ezdxf)
GRAPESファイルをdxf形式ファイルに変換したプログラムです。
GPS_Text以下は、GRAPESファイルです。
import ezdxf
from sympy import *
def myTextInit(myText):
    GPS_List = myText.splitlines()
    del GPS_List[0]
    joined = '\n'.join(GPS_List)
    return joined
def myTextIndex(myText,n):
    GPS_List = myText.splitlines()
    return GPS_List[n-1]
GPS_Text="""
Grapes/win 2.9
[Don't Edit] 3.14
----------
BGstretchOn BGfile
1
----------
UserFunction
0
----------
y = f(x)
0
----------
0 = f(x,y)
0
----------
Point
22 0 0 0 0 0 0 0 1 2 3 4 5 6 0 0 0 0 0 0 0 0 22 1 1 1 1 1 1 1 1 1 1 1 1 1 1 1 1 1 1 1 1 1 0
P
0 3 2
Q
0 3 2
R
0 3 2
S
0 3 2
T
0 3 2
U
0 3 2
V
0 3 2
A
1 3 2
A
-sqrt(5/8 - sqrt(5)/8)
-sqrt(5)/4 - 1/4
0


t 0.1
0 0
16711680 16711680 16777215 1 0 1 3 1 0 0
4 0 3 0 0
B
1 3 2
B
sqrt(5/8 - sqrt(5)/8)
-sqrt(5)/4 - 1/4
0


t 0.1
0 0
16711680 16711680 16777215 1 0 1 3 1 0 0
4 0 3 0 0
C
1 3 2
C
sqrt(sqrt(5)/8 + 5/8)
-1/4 + sqrt(5)/4
0


t 0.1
0 0
16711680 16711680 16777215 1 0 1 3 1 0 0
4 0 3 0 0
D
1 3 2
D
0
1
0


t 0.1
0 0
16711680 16711680 16777215 1 0 1 3 1 0 0
4 0 3 0 0
E
1 3 2
E
-sqrt(sqrt(5)/8 + 5/8)
-1/4 + sqrt(5)/4
0


t 0.1
0 0
16711680 16711680 16777215 1 0 1 3 1 0 0
4 0 3 0 0
F
1 3 2

-sqrt(5/8 - sqrt(5)/8)
-sqrt(5)/4 - 1/4
0


t 0.1
0 0
16711680 16711680 16777215 1 0 1 3 1 0 0
4 0 3 0 0
G
0 3 2
H
0 3 2
I
0 3 2
J
0 3 2
K
0 3 2
L
0 3 2
M
0 3 2
N
0 3 2
O
1 0 2
O
0
0


t 0.1
0 0
16777215 16711680 16777215 1 0 0 3 1 0 0
4 0 2 0 0
----------
Segments
1
6 1 1 16711680 16777215 2 0 1 1 0 1
0
8 9 10 11 12 13 0 0 0 0 0 0 0 0 0 0 0 0 0 0 0 0
----------
paramater
14
1 0
1 1 0.1 1 0 0
1 0
1 1 0.1 1 0 0
1 0
1 1 0.1 1 0 0
1 0
1 1 0.1 1 0 0
1 0
1 1 0.1 1 0 0
1 0
1 1 0.1 1 0 0
1 0
1 1 0.1 1 0 0
1 0
1 1 0.1 1 0 0
1 0
1 1 0.1 1 0 0
1 0
1 1 0.1 1 0 0
1 0
1 1 0.1 1 0 0
1 0
1 1 0.1 1 0 0
0 0
1 1 0.1 1 0 0
1 0
1 1 0.1 1 0 0
1 1 98
----------
KakuMode ScanWidth LogMode ThetaMode AreaMode capStyle
1 4 2 2 1 0 1 1 0 1 0 40 0 0
DrawMode SegmentShowSync
1 0
AfterImageColorNo, CanAImg,MaxAimgN0
2 1 3001
circleMode
1
----------
ScaleX
Vlow,VHigh,label
0 910 x
x
AxesVisible,ScaleVisible,Svaluevisible,AddDegreeLetter,ScaleGuidevisible,scaleSubvisible
1 1 1 0 1 0
NUmber,Base,Linterval,numberR
8 1 1 8
High,Low
5 -5
----------
ScaleY
Vlow,VHigh,label
0 910 y
AxesVisible,ScaleVisible,Svaluevisible,ScaleGuidevisible,add-i,scalesubvisible
1 1 1 1 0 0
NUmber,Base,Linterval,NumbeerR
8 1 1 8
High,Low
5 -5
----------
ScaleS
SquareQ AreaRectify PsMesh AxisWidth FontSize AxisOn letterCenterShowPOsition ShowEquation AxisType PolorNum Areafixed
0 1 0 1 14 0 0 0 0 0 8 0 0 0 24
----------
Yvalue
1 1
----------
Iinterval
Svalue Evalue sliceNo
1 -1
1 1
40 10
Dfuncno Efuncno AreaQ
1 0 0
----------
Yvalue Function List
0
----------
Panel Position
0 32 64 96 326 358 390 422 1 1 1 1 1 1 1 1
1
----------
PetaMEMO SECTION
Style, Color, BGcolor , height, PositionX, positionY
3 16711680 0 14 24 0 0

0


----------
21
0 -38 0
0 -38 0
0 -38 0
0 -38 0
0 -38 0
0 -38 0
0 -38 0
0 -38 0
0 -38 0
0 -38 0
0 -38 0
0 -38 0
0 -38 0
0 -38 0
0 -38 0
0 -38 0
0 -38 0
0 -38 0
0 -38 0
0 -38 0
0 -38 0
----------
Table SECTION
RowNo, ColumnNo
0 10 201
Table Data


60 60 60 60 60 60 60 60 60 60
----------
SimpleMemo SECTION
0
----------
"""
GPS_Text=myTextInit(GPS_Text)
#
doc = ezdxf.new("R2000")
msp = doc.modelspace()
points = [
          (sympify(myTextIndex(GPS_Text,35)),sympify(myTextIndex(GPS_Text,36))),
          (sympify(myTextIndex(GPS_Text,47)),sympify(myTextIndex(GPS_Text,48))),
          (sympify(myTextIndex(GPS_Text,59)),sympify(myTextIndex(GPS_Text,60))),
          (sympify(myTextIndex(GPS_Text,71)),sympify(myTextIndex(GPS_Text,72))),
          (sympify(myTextIndex(GPS_Text,83)),sympify(myTextIndex(GPS_Text,84))),
          (sympify(myTextIndex(GPS_Text,95)),sympify(myTextIndex(GPS_Text,96)))
]
msp.add_lwpolyline(points)
msp.add_text(myTextIndex(GPS_Text,34), height=0.2,dxfattribs={'style': 'standard'}).set_pos((points[0][0], points[0][1]))
msp.add_text(myTextIndex(GPS_Text,46), height=0.2,dxfattribs={'style': 'standard'}).set_pos((points[1][0], points[1][1]))
msp.add_text(myTextIndex(GPS_Text,58), height=0.2,dxfattribs={'style': 'standard'}).set_pos((points[2][0], points[2][1]))
msp.add_text(myTextIndex(GPS_Text,70), height=0.2,dxfattribs={'style': 'standard'}).set_pos((points[3][0], points[3][1]))
msp.add_text(myTextIndex(GPS_Text,82), height=0.2,dxfattribs={'style': 'standard'}).set_pos((points[4][0], points[4][1]))
msp.add_text(myTextIndex(GPS_Text,94), height=0.2,dxfattribs={'style': 'standard'}).set_pos((points[5][0], points[5][1]))
doc.saveas("dxf.dxf")
出力のdxf.dxfは、約3000行です。(省略)
考察
「関数グラフソフトGRAPESの正五角形」を3次元FreeCADへ(FreeCADマクロへ変換するプログラム作成)出力しようと思いましたが、
よく考えたら、
GRAPES→DXF→FreeCADで十分でした。
参考
その後,dxf→freecad→png
(20221022)
FreeCADで,dxfファイルをインポートしました。
多分。初期設定のままのはずです。
dxfの線分は出ました。
dxfのA,B,C,D,Eの文字は出ませんでした。
参考

