Optunaを使ったRandomforestの設定方法
修正200808
整数で与えた方が良いのは、suggest_intで与えることにしました。
パラメータは、公式HPから抽出しました。
https://scikit-learn.org/stable/modules/generated/sklearn.ensemble.RandomForestRegressor.html
修正200704
よく考えたら、max_depth,n_estimators 等は、離散値suggest_discrete_uniform(name, low, high, q)で与えるべきでしたので、スクリプトを修正しました。
max_depth,n_estimators,max_leaf_nodesは離散値suggest_discrete_uniformだと、型がfloatになってしまうので、int(suggest_discrete_uniform())にして、型を整数型に変更して渡しています。
修正前
前回Optunaの使い方を書いたので、これからは個別の設定方法について記載しようと思う。。
Randomforestで渡せる引数は、いろいろあるが、主なものをすべてOptunaで設定してみた。
max_depth,n_estimators を整数で渡すべきか、数をカテゴリーとして渡すべきか、悩んだが、今回は整数で渡した。
# optunaの目的関数を設定する
def objective(trial):
    criterion = trial.suggest_categorical('criterion', ['mse', 'mae'])
    bootstrap = trial.suggest_categorical('bootstrap',['True','False'])
    max_depth = trial.suggest_int('max_depth', 1, 1000)
    max_features = trial.suggest_categorical('max_features', ['auto', 'sqrt','log2'])
    max_leaf_nodes = trial.suggest_int('max_leaf_nodes', 1,1000)
    n_estimators =  trial.suggest_int('n_estimators', 1, 1000)
    min_samples_split = trial.suggest_int('min_samples_split',2,5)
    min_samples_leaf = trial.suggest_int('min_samples_leaf',1,10)

    regr = RandomForestRegressor(bootstrap = bootstrap, criterion = criterion,
                                 max_depth = max_depth, max_features = max_features,
                                 max_leaf_nodes = max_leaf_nodes,n_estimators = n_estimators,
                                 min_samples_split = min_samples_split,min_samples_leaf = min_samples_leaf,
                                 n_jobs=2)

    score = cross_val_score(regr, X_train, y_train, cv=5, scoring="r2")
    r2_mean = score.mean()
    print(r2_mean)

    return r2_mean
# optunaで学習
study = optuna.create_study(direction='maximize')
study.optimize(objective, n_trials=100)

# チューニングしたハイパーパラメーターをフィット
optimised_rf = RandomForestRegressor(bootstrap = study.best_params['bootstrap'], criterion = study.best_params['criterion'],
                                     max_depth = study.best_params['max_depth'], max_features = study.best_params['max_features'],
                                     max_leaf_nodes = study.best_params['max_leaf_nodes'],n_estimators = study.best_params['n_estimators'],
                                     min_samples_split = study.best_params['min_samples_split'],min_samples_leaf = study.best_params['min_samples_leaf'],
                                     n_jobs=2)

optimised_rf.fit(X_train ,y_train)
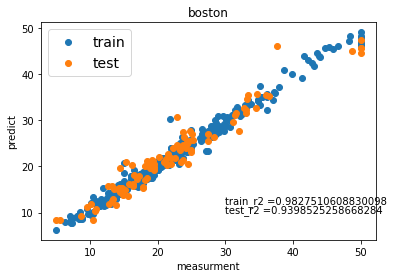
これを使って、Bostonのデータセットを使って、ハイパーパラメーターをチューニングしてみました。
いい感じにフィットしました。
全体のスクリプト
# -*- coding: utf-8 -*-

from sklearn import datasets
from sklearn.ensemble import RandomForestRegressor
from sklearn.model_selection import train_test_split
from sklearn.metrics import r2_score
import pandas as pd
import optuna
import numpy as np
import matplotlib.pyplot as plt
from sklearn.model_selection import cross_val_score

# ボストンのデータセットを読み込む
boston = datasets.load_boston()

# print(boston['feature_names'])
# 特徴量と目的変数をわける
X = boston['data']
y = boston['target']
X_train, X_test, y_train, y_test = train_test_split(X, y, train_size=0.8)

# optunaの目的関数を設定する
def objective(trial):
    criterion = trial.suggest_categorical('criterion', ['mse', 'mae'])
    bootstrap = trial.suggest_categorical('bootstrap',['True','False'])
    max_depth = trial.suggest_int('max_depth', 1, 1000)
    max_features = trial.suggest_categorical('max_features', ['auto', 'sqrt','log2'])
    max_leaf_nodes = trial.suggest_int('max_leaf_nodes', 1,1000)
    n_estimators =  trial.suggest_int('n_estimators', 1, 1000)
    min_samples_split = trial.suggest_int('min_samples_split',2,5)
    min_samples_leaf = trial.suggest_int('min_samples_leaf',1,10)

    regr = RandomForestRegressor(bootstrap = bootstrap, criterion = criterion,
                                 max_depth = max_depth, max_features = max_features,
                                 max_leaf_nodes = max_leaf_nodes,n_estimators = n_estimators,
                                 min_samples_split = min_samples_split,min_samples_leaf = min_samples_leaf,
                                 n_jobs=2)

    score = cross_val_score(regr, X_train, y_train, cv=5, scoring="r2")
    r2_mean = score.mean()
    print(r2_mean)

    return r2_mean

# optunaで最適値を見つける
study = optuna.create_study(direction='maximize')
study.optimize(objective, n_trials=100)

# チューニングしたハイパーパラメーターをフィット
optimised_rf = RandomForestRegressor(bootstrap = study.best_params['bootstrap'], criterion = study.best_params['criterion'],
                                     max_depth = study.best_params['max_depth'], max_features = study.best_params['max_features'],
                                     max_leaf_nodes = study.best_params['max_leaf_nodes'],n_estimators = study.best_params['n_estimators'],
                                     min_samples_split = study.best_params['min_samples_split'],min_samples_leaf = study.best_params['min_samples_leaf'],

                                     n_jobs=2)

optimised_rf.fit(X_train ,y_train)
# 結果の表示
print("訓練データにフィット")
print("訓練データの精度 =", optimised_rf.score(X_train, y_train))
pre_train = optimised_rf.predict(X_train)
print("テストデータにフィット")
print("テストデータの精度 =", optimised_rf.score(X_test, y_test))
pre_test = optimised_rf.predict(X_test)

# グラフの表示
plt.scatter(y_train, pre_train, marker='o', cmap = "Blue", label="train")
plt.scatter(y_test ,pre_test, marker='o', cmap= "Red", label="test")
plt.title('boston')
plt.xlabel('measurment')
plt.ylabel('predict')
# ここでテキストは微調整する
x = 30
y1 = 12
y2 = 10
s1 =  "train_r2 =" + str(optimised_rf.score(X_train, y_train))
s2 =  "test_r2 =" + str(optimised_rf.score(X_test, y_test))
plt.text(x, y1, s1)
plt.text(x, y2, s2)

plt.legend(loc="upper left", fontsize=14)
plt.show()
