Optunaを使ったxgboostの設定方法
xgboostの回帰について設定してみる。
xgboostについては、他のHPを参考にしましょう。
「ザックリとした『Xgboostとは』& 主要なパラメータについてのメモ」
https://qiita.com/2357gi/items/913af8b813b069617aad
後、公式HPのパラメーターのところを参考にしました。
https://xgboost.readthedocs.io/en/latest/parameter.html
いろいろ入れたけど、決定木系は過学習になりやすいので、それを制御するパラメーターをしっかり設定した方が良いと思ってます。
xgboostでは、lambdaとalphaですが、pythonで設定するときは、reg_lambdaとreg_alphaのように、reg_をつけて指定します。
# optunaの目的関数を設定する
# gtreeのパラメーター設定です。
def objective(trial):
    eta =  trial.suggest_loguniform('eta', 1e-8, 1.0)
    gamma = trial.suggest_loguniform('gamma', 1e-8, 1.0)
    max_depth = trial.suggest_int('max_depth', 1, 20)
    min_child_weight = trial.suggest_loguniform('min_child_weight', 1e-8, 1.0)
    max_delta_step = trial.suggest_loguniform('max_delta_step', 1e-8, 1.0)
    subsample = trial.suggest_uniform('subsample', 0.0, 1.0)
    reg_lambda = trial.suggest_uniform('reg_lambda', 0.0, 1000.0)
    reg_alpha = trial.suggest_uniform('reg_alpha', 0.0, 1000.0)


    regr =xgb.XGBRegressor(eta = eta, gamma = gamma, max_depth = max_depth,
                           min_child_weight = min_child_weight, max_delta_step = max_delta_step,
                           subsample = subsample,reg_lambda = reg_lambda,reg_alpha = reg_alpha)

    score = cross_val_score(regr, X_train, y_train, cv=5, scoring="r2")
    r2_mean = score.mean()
    print(r2_mean)

    return r2_mean
# optunaで最適値を見つける
study = optuna.create_study(direction='maximize')
study.optimize(objective, n_trials=500)

# チューニングしたハイパーパラメーターをフィット
optimised_rf = xgb.XGBRegressor(eta = study.best_params['eta'],gamma = study.best_params['gamma'],
                                max_depth = study.best_params['max_depth'],min_child_weight = study.best_params['min_child_weight'],
                                max_delta_step = study.best_params['max_delta_step'],subsample = study.best_params['subsample'],
                                reg_lambda = study.best_params['reg_lambda'],reg_alpha = study.best_params['reg_alpha'])

optimised_rf.fit(X_train ,y_train)
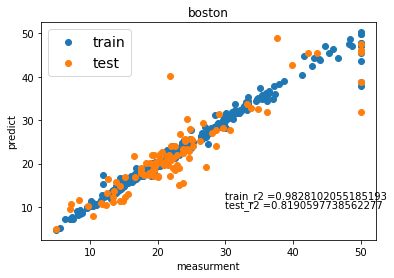
ボストンの結果です。
全部です。
# -*- coding: utf-8 -*-

from sklearn import datasets
import xgboost as xgb
from sklearn.model_selection import train_test_split
from sklearn.metrics import r2_score
import pandas as pd
import optuna
import numpy as np
import matplotlib.pyplot as plt
from sklearn.model_selection import cross_val_score

# ボストンのデータセットを読み込む
boston = datasets.load_boston()

# print(boston['feature_names'])
# 特徴量と目的変数をわける
X = boston['data']
y = boston['target']
X_train, X_test, y_train, y_test = train_test_split(X, y, train_size=0.8)

# optunaの目的関数を設定する
# gtreeのパラメーター設定です。
def objective(trial):
    eta =  trial.suggest_loguniform('eta', 1e-8, 1.0)
    gamma = trial.suggest_loguniform('gamma', 1e-8, 1.0)
    max_depth = trial.suggest_int('max_depth', 1, 20)
    min_child_weight = trial.suggest_loguniform('min_child_weight', 1e-8, 1.0)
    max_delta_step = trial.suggest_loguniform('max_delta_step', 1e-8, 1.0)
    subsample = trial.suggest_uniform('subsample', 0.0, 1.0)
    reg_lambda = trial.suggest_uniform('reg_lambda', 0.0, 1000.0)
    reg_alpha = trial.suggest_uniform('reg_alpha', 0.0, 1000.0)


    regr =xgb.XGBRegressor(eta = eta, gamma = gamma, max_depth = max_depth,
                           min_child_weight = min_child_weight, max_delta_step = max_delta_step,
                           subsample = subsample,reg_lambda = reg_lambda,reg_alpha = reg_alpha)

    score = cross_val_score(regr, X_train, y_train, cv=5, scoring="r2")
    r2_mean = score.mean()
    print(r2_mean)

    return r2_mean

# optunaで最適値を見つける
study = optuna.create_study(direction='maximize')
study.optimize(objective, n_trials=500)

# チューニングしたハイパーパラメーターをフィット
optimised_rf = xgb.XGBRegressor(eta = study.best_params['eta'],gamma = study.best_params['gamma'],
                                max_depth = study.best_params['max_depth'],min_child_weight = study.best_params['min_child_weight'],
                                max_delta_step = study.best_params['max_delta_step'],subsample = study.best_params['subsample'],
                                reg_lambda = study.best_params['reg_lambda'],reg_alpha = study.best_params['reg_alpha'])

optimised_rf.fit(X_train ,y_train)
# 結果の表示
print("訓練データにフィット")
print("訓練データの精度 =", optimised_rf.score(X_train, y_train))
pre_train = optimised_rf.predict(X_train)
print("テストデータにフィット")
print("テストデータの精度 =", optimised_rf.score(X_test, y_test))
pre_test = optimised_rf.predict(X_test)

# グラフの表示
plt.scatter(y_train, pre_train, marker='o', cmap = "Blue", label="train")
plt.scatter(y_test ,pre_test, marker='o', cmap= "Red", label="test")
plt.title('boston')
plt.xlabel('measurment')
plt.ylabel('predict')
# ここでテキストは微調整する
x = 30
y1 = 12
y2 = 10
s1 =  "train_r2 =" + str(optimised_rf.score(X_train, y_train))
s2 =  "test_r2 =" + str(optimised_rf.score(X_test, y_test))
plt.text(x, y1, s1)
plt.text(x, y2, s2)

plt.legend(loc="upper left", fontsize=14)
plt.show()
