無料で金融アルゴリズムが作れるQuantxを使ってみた
Quantxとは
株式会社SmartTradeが提供しているアルゴリズム開発プラットフォーム
QuantX Factoryホームページ
無料でアルゴリズムを作成してバックテストするほか、アルゴリズムを販売したり、購入したりすることができる。2018/12/05時点では、ロイター社からデータの提供を受けており、センチメントデータを用いたアルゴリズムの作成も無料で行うことができる。
使うことのできるデータはQuantxの公式ドキュメントから
QuantXの公式ドキュメントのページ
せっかくなので、ロイター社から提供を受けているデータを使ってみる
 **EPS**, **PER**,**PBR**, **ROE**が使えるらしい
つい先日理論株価についてDCF法を勉強したので
理論株価を使ったアルゴリズムを作ってみたい
早速、試してみようと思いまーす‼️‼️
どうも理論株価の求め方は単純なものから複雑なものまで何種類もあるらしくDCF法が無理でも、単純なものならできそーーー
ロイターのデータを生かすことができるものを発見‼️
理論株価=現在BPS+現在EPS*PER
という求め方が存在
ただ、残念なことに、ロイター社提供のデータにはBPSがない模様(2018/12/05時点)
だけど、PBR=株価/BPSなので
BPS=株価/PBRで代用できる
ということで、早速、理論株価と現在株価との乖離を用いたアルゴリズムを書いてみます
import pandas as pd
import numpy as np

def initialize(ctx):

    # 設定
    ctx.configure(
        target="jp.stock.daily",
        channels={          # 利用チャンネル
            "jp.stock": {
              "symbols": [
"jp.stock.9045",
"jp.stock.7832",
"jp.stock.8028",
"jp.stock.8933",
"jp.stock.9503",
"jp.stock.9533",
"jp.stock.3360",
"jp.stock.3405",
"jp.stock.5105",
"jp.stock.4452",
"jp.stock.8113",
"jp.stock.6463",
"jp.stock.4681",
"jp.stock.9086",


              ],
              "columns": [
                "high_price_adj",
                "low_price_adj",
                "close_price_adj",
                "eps",
                "per",
                "pbr",

              ]
            }
        }
    )

    def _TALIB_CALL(data):
      hp=data["high_price_adj"].fillna(method="ffill")
      lp=data["low_price_adj"].fillna(method="ffill")
      cp=data["close_price_adj"].fillna(method='ffill')


      eps = data["eps"].fillna(method="ffill")

      per=data['per'].fillna(method='ffill')

      pbr=data["pbr"].fillna(method='ffill')

      bps=pd.DataFrame(data=0,columns=[],index=cp.index)
      index1=pd.DataFrame(data=0,columns=[],index=cp.index)
      index2=pd.DataFrame(data=0,columns=[],index=cp.index)
      index3=pd.DataFrame(data=0,columns=[],index=cp.index)
      index4=pd.DataFrame(data=0,columns=[],index=cp.index)
      index5=pd.DataFrame(data=0,columns=[],index=cp.index)

      for (sym,val) in cp.items():
        bps[sym]=cp[sym]/pbr[sym]
        index1[sym]=bps[sym]+(per[sym]*eps[sym])
        index2[sym]=index1[sym]/cp[sym]
        index3[sym]=index2[sym].rolling(window=365,center=False).max()
        index4[sym]=index2[sym].rolling(window=365,center=False).min()
        index5[sym]=(index2[sym]-index4[sym])/(index3[sym]-index4[sym])


      buy_sig =index5[(index5>=0.9)]
      sell_sig =index5[(index5<=0.18)]

      buy_sig[~np.isnan(buy_sig)] = 1.0      # normalize signal
      sell_sig[~np.isnan(buy_sig)] = np.nan  # clear sell_sig if buy_sig is positive
      sell_sig[~np.isnan(sell_sig)] = 1.0    # normalize signal

        # this signal willrequire from next version.
        # neutral: 0.0, positive: 1.0, negative: -1.0
      market_sig = pd.DataFrame(data=0.0, columns=buy_sig.columns, index=buy_sig.index)
      market_sig[buy_sig == 1.0] = 1.0
      market_sig[sell_sig == 1.0] = -1.0

      return {
        "_eps":data["eps"].fillna(method="ffill"),
        "_per":data["per"].fillna(method="ffill"),
        "_pbr":data["pbr"].fillna(method="ffill"),
        "buy:sig": buy_sig,
        "sell:sig": sell_sig,
        "index1":index1,
        "index2":index2,
        "index3":index3,
        "index4":index4,
        "index5":index5,
      }

    # シグナル登録
    ctx.regist_signal("TALIB", _TALIB_CALL)

def handle_signals(ctx, date, current):


    buy = current["buy:sig"].dropna()
    #buy = buy[~buy.index.isin(done_syms)]
    for (sym,val) in buy.items():
        sec = ctx.getSecurity(sym)
        sec.order(sec.unit() * 1, comment="SIGNAL BUY")

        ctx.logger.debug("BUY: %s,  %f" % (sec.code(), val))

    sell = current["sell:sig"].dropna()
    #sell = sell[~sell.index.isin(done_syms)]
    for (sym,val) in sell.items():
        sec = ctx.getSecurity(sym)
        sec.order(sec.unit() * -1, comment="SIGNAL SELL")
        ctx.logger.debug("SELL: %s,  %f" % (sec.code(), val))
ざっとこんな感じですかねーーーー
銘柄はロイター社提供のデータを使う場合は、JP日経400採用銘柄しか使えないよう(2018/12/05時点)なので、その中から良さそうなものを選びました。("jp.stock.4桁")の部分で証券番号を指定して使っています。
使用可能銘柄については、詳しくはQuantXの公式ドキュメントを見てください。
QuantXの公式ドキュメントのページ
バックテストをやってみますーーーー‼️

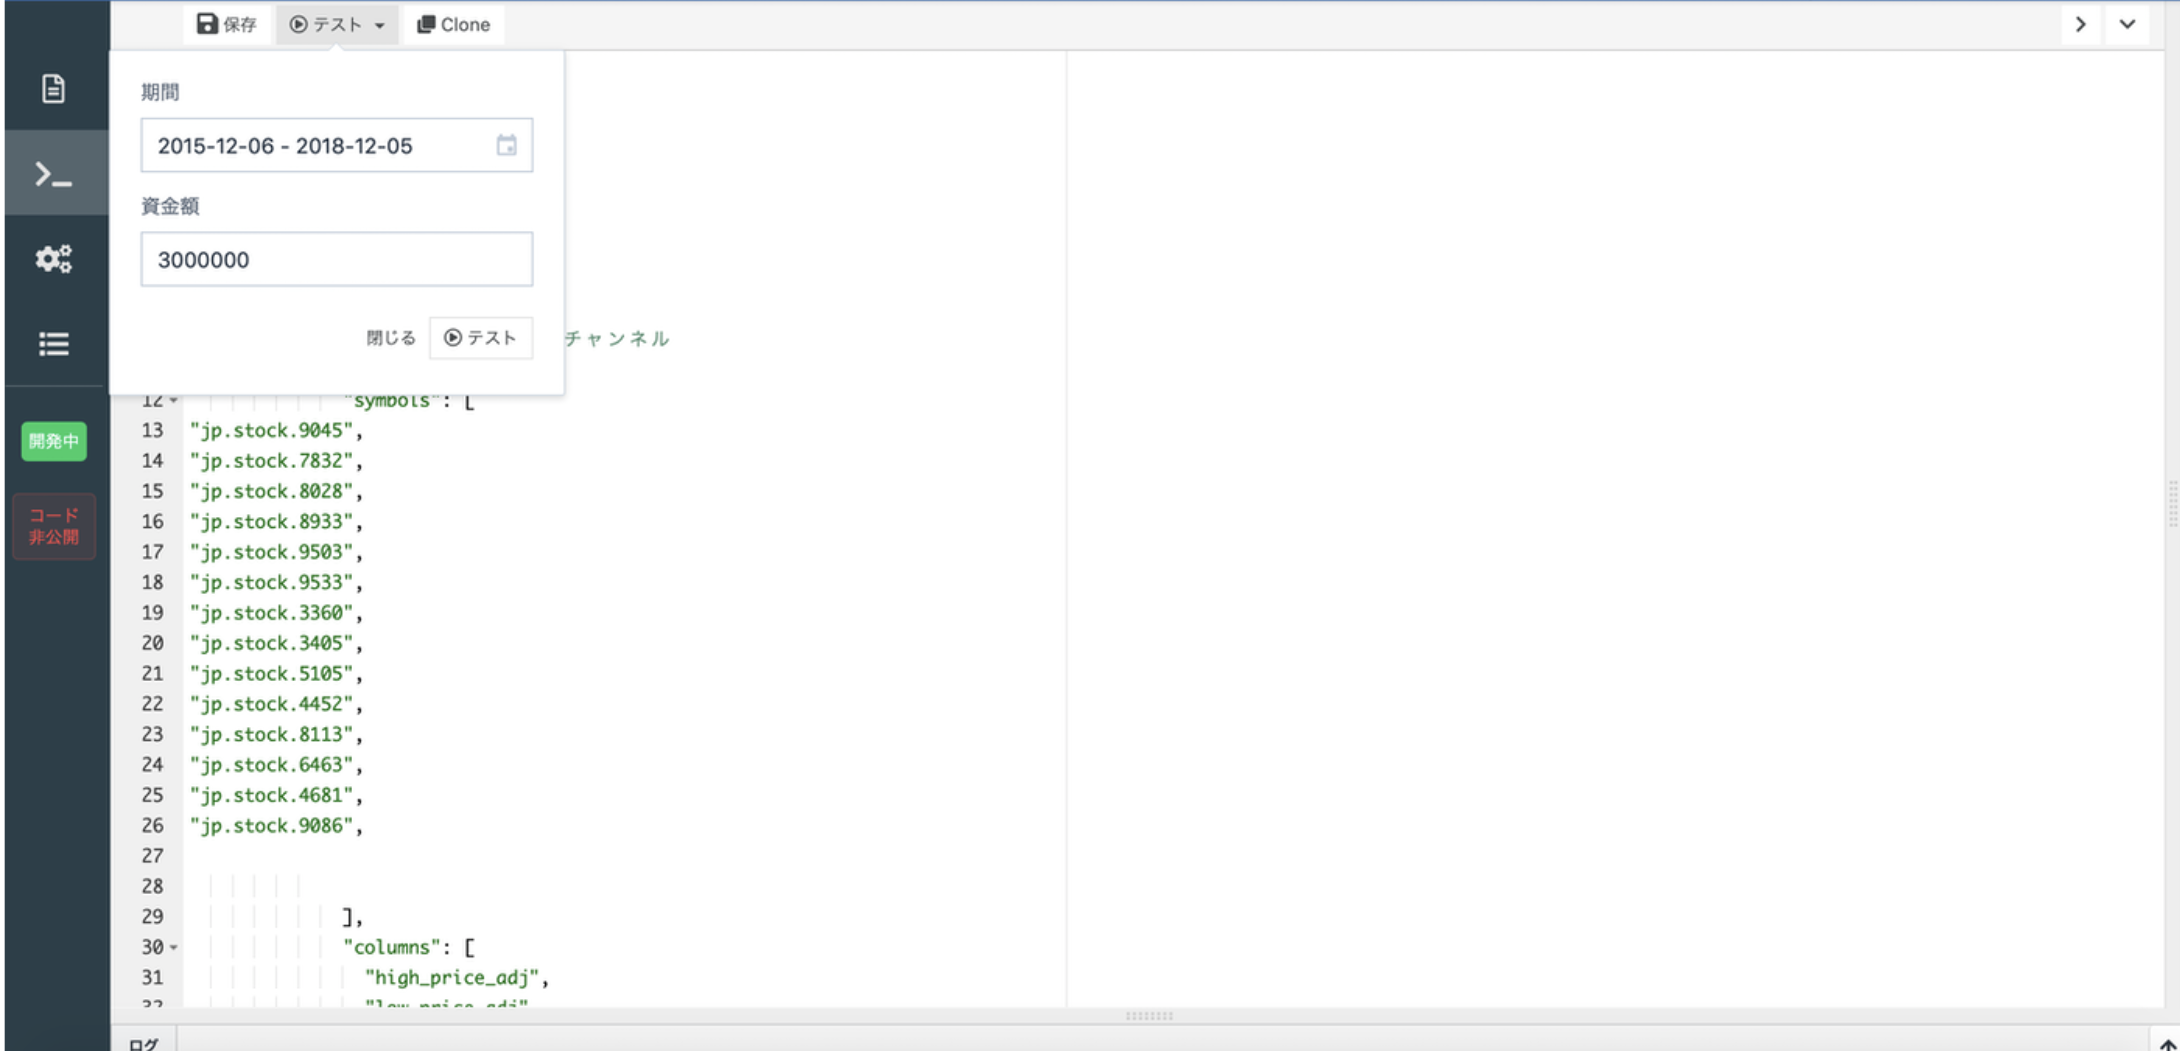
期間は3年でバックテストしてみまーす。
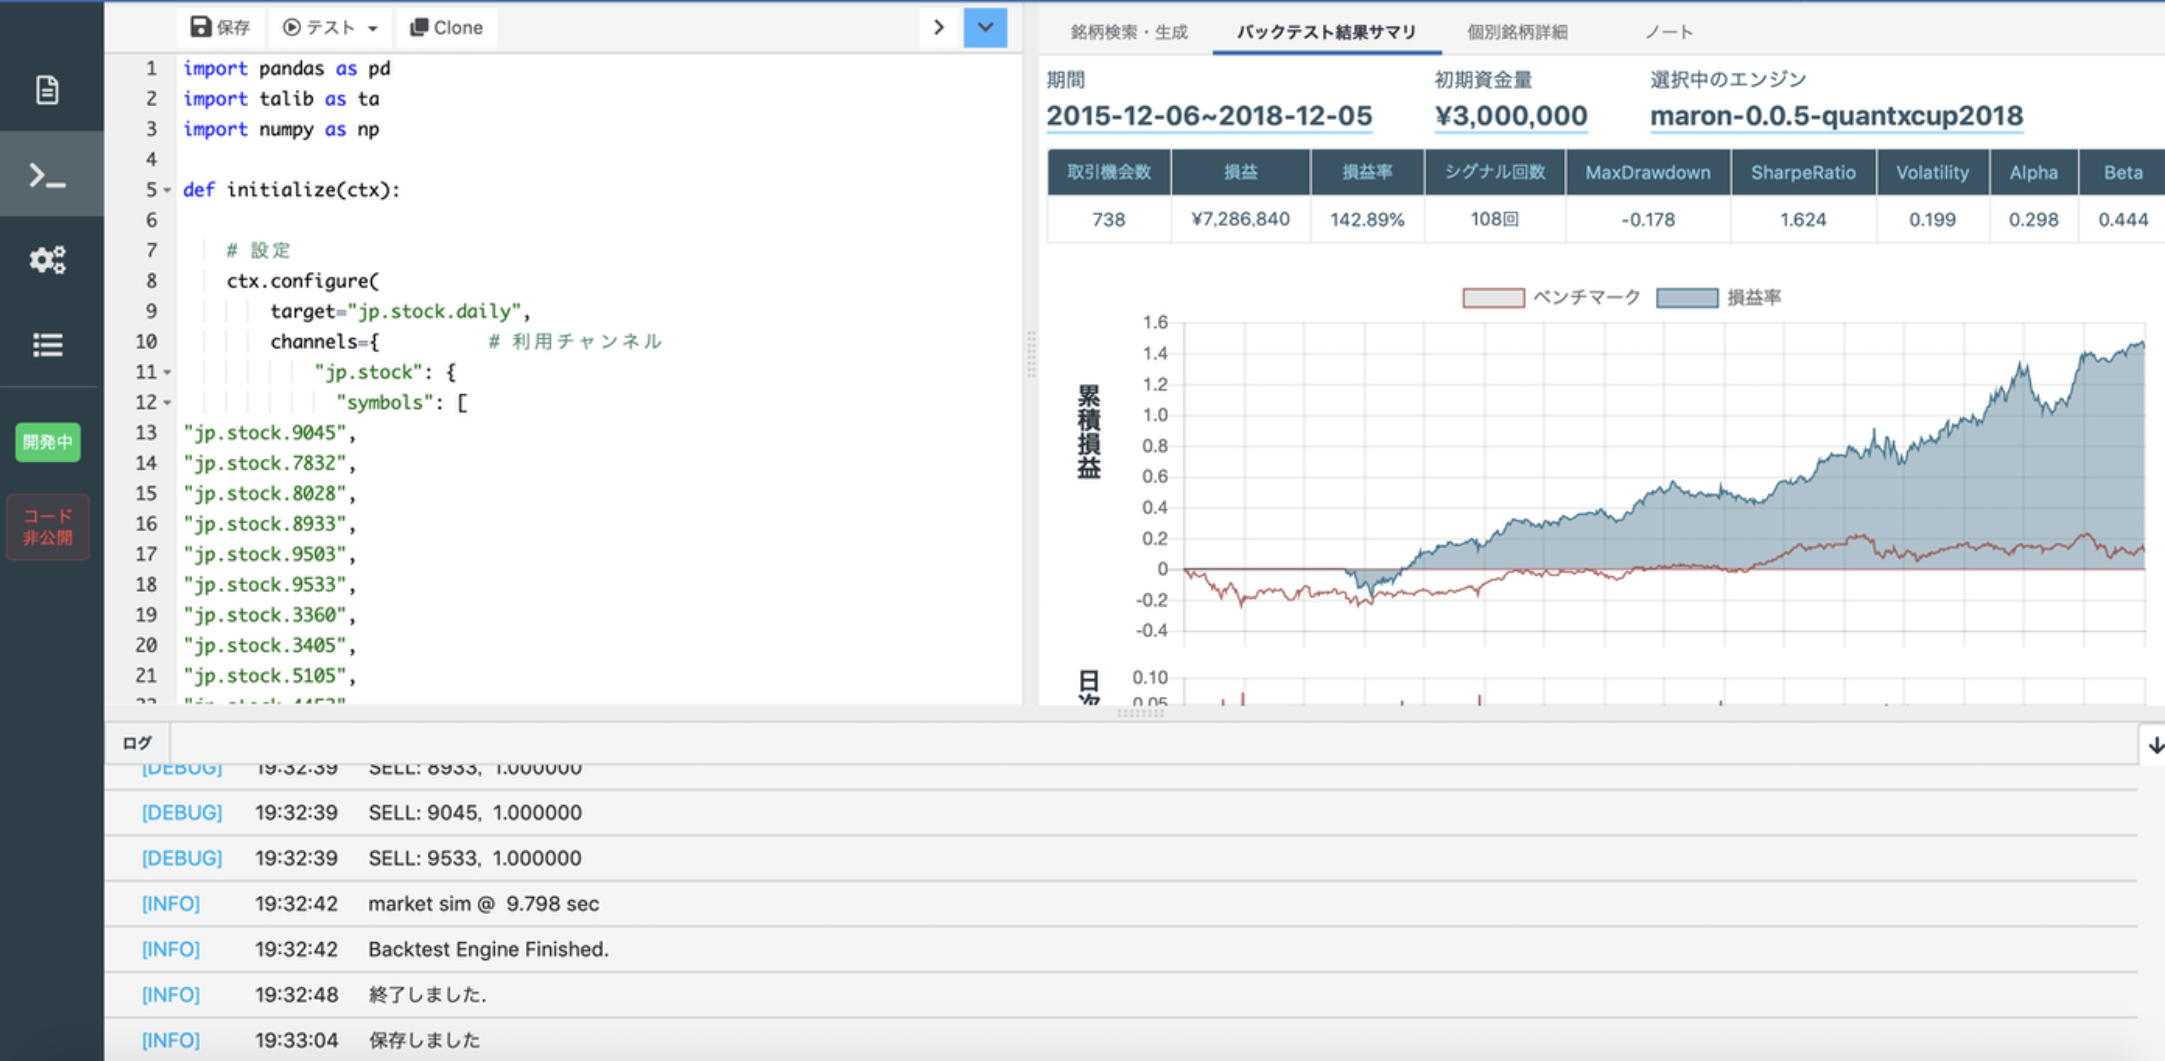
結果はこんな感じでーす。
3年で損益率**142.89%**です‼️ **Maxdrowdownは-17.8%**と微妙なラインですが、、、、
意外といいかも⁉️
ただ、もっと改善したいと思っちゃったので、、、、
改善していく
もう一つ指標を入れてみまーす。
ストキャスティクスという指標を用いてみたいと思います。
なんとこれ、わざわざ自分でコードを書かなくても、talibというライブラリを用いるとわずか数行で簡単に実装できるんです。
talibをimportして
 slowk[sym],slowd[sym]=ta.STOCH(hp[sym].values.astype(np.double),
                                       lp[sym].values.astype(np.double),
                                       cp[sym].values.astype(np.double),
                                       fastk_period=120,slowk_period=40,slowk_matype=0,slowd_period=3,slowd_matype=0)
        fastk[sym],fastd[sym]=ta.STOCHF(hp[sym].values.astype(np.double),
                                        lp[sym].values.astype(np.double),
                                           cp[sym].values.astype(np.double),
                                           fastk_period=120,fastd_period=40,fastd_matype=0)
これで簡単にストキャスティクスを計算できます。
あとは細かくシグナルを発する状況を規定して、欲しい返り値を決めておくだけです。
import pandas as pd
import talib as ta
import numpy as np

def initialize(ctx):

    # 設定
    ctx.configure(
        target="jp.stock.daily",
        channels={          # 利用チャンネル
            "jp.stock": {
              "symbols": [
"jp.stock.9045",
"jp.stock.7832",
"jp.stock.8028",
"jp.stock.8933",
"jp.stock.9503",
"jp.stock.9533",
"jp.stock.3360",
"jp.stock.3405",
"jp.stock.5105",
"jp.stock.4452",
"jp.stock.8113",
"jp.stock.6463",
"jp.stock.4681",
"jp.stock.9086",


              ],
              "columns": [
                "high_price_adj",
                "low_price_adj",
                "close_price_adj",
                "eps",
                "per",
                "pbr",

              ]
            }
        }
    )

    def _TALIB_CALL(data):
      hp=data["high_price_adj"].fillna(method="ffill")
      lp=data["low_price_adj"].fillna(method="ffill")
      cp=data["close_price_adj"].fillna(method='ffill')


      eps = data["eps"].fillna(method="ffill")

      per=data['per'].fillna(method='ffill')

      pbr=data["pbr"].fillna(method='ffill')

      bps=pd.DataFrame(data=0,columns=[],index=cp.index)
      index1=pd.DataFrame(data=0,columns=[],index=cp.index)
      index2=pd.DataFrame(data=0,columns=[],index=cp.index)
      index3=pd.DataFrame(data=0,columns=[],index=cp.index)
      index4=pd.DataFrame(data=0,columns=[],index=cp.index)
      index5=pd.DataFrame(data=0,columns=[],index=cp.index)
      slowk=pd.DataFrame(data=0,columns=[],index=cp.index)
      slowd=pd.DataFrame(data=0,columns=[],index=cp.index)
      fastk=pd.DataFrame(data=0,columns=[],index=cp.index)
      fastd=pd.DataFrame(data=0,columns=[],index=cp.index)
      for (sym,val) in cp.items():
        bps[sym]=cp[sym]/pbr[sym]
        index1[sym]=bps[sym]+(per[sym]*eps[sym])
        index2[sym]=index1[sym]/cp[sym]
        index3[sym]=index2[sym].rolling(window=365,center=False).max()
        index4[sym]=index2[sym].rolling(window=365,center=False).min()
        index5[sym]=(index2[sym]-index4[sym])/(index3[sym]-index4[sym])
        slowk[sym],slowd[sym]=ta.STOCH(hp[sym].values.astype(np.double),
                                       lp[sym].values.astype(np.double),
                                       cp[sym].values.astype(np.double),
                                       fastk_period=120,slowk_period=40,slowk_matype=0,slowd_period=3,slowd_matype=0)
        fastk[sym],fastd[sym]=ta.STOCHF(hp[sym].values.astype(np.double),
                                        lp[sym].values.astype(np.double),
                                           cp[sym].values.astype(np.double),
                                           fastk_period=120,fastd_period=40,fastd_matype=0)


      buy_sig =index5[(index5>=0.9)&(fastd<=24)]
      sell_sig =index5[(index5<=0.18)&(fastd>=85)]

      buy_sig[~np.isnan(buy_sig)] = 1.0      # normalize signal
      sell_sig[~np.isnan(buy_sig)] = np.nan  # clear sell_sig if buy_sig is positive
      sell_sig[~np.isnan(sell_sig)] = 1.0    # normalize signal

        # this signal willrequire from next version.
        # neutral: 0.0, positive: 1.0, negative: -1.0
      market_sig = pd.DataFrame(data=0.0, columns=buy_sig.columns, index=buy_sig.index)
      market_sig[buy_sig == 1.0] = 1.0
      market_sig[sell_sig == 1.0] = -1.0

      return {
        "_eps":data["eps"].fillna(method="ffill"),
        "_per":data["per"].fillna(method="ffill"),
        "_pbr":data["pbr"].fillna(method="ffill"),
        "buy:sig": buy_sig,
        "sell:sig": sell_sig,
        "index1":index1,
        "index2":index2,
        "index3":index3,
        "index4":index4,
        "index5":index5,
        "slowk":slowk,
        "slowd":slowd,
        "fastk":fastk,
        "fastd":fastd
      }

    # シグナル登録
    ctx.regist_signal("TALIB", _TALIB_CALL)

def handle_signals(ctx, date, current):
    buy = current["buy:sig"].dropna()
    #buy = buy[~buy.index.isin(done_syms)]
    for (sym,val) in buy.items():
        sec = ctx.getSecurity(sym)
        sec.order(sec.unit() * 1, comment="SIGNAL BUY")

        ctx.logger.debug("BUY: %s,  %f" % (sec.code(), val))

    sell = current["sell:sig"].dropna()
    #sell = sell[~sell.index.isin(done_syms)]
    for (sym,val) in sell.items():
        sec = ctx.getSecurity(sym)
        sec.order(sec.unit() * -1, comment="SIGNAL SELL")
        ctx.logger.debug("SELL: %s,  %f" % (sec.code(), val))
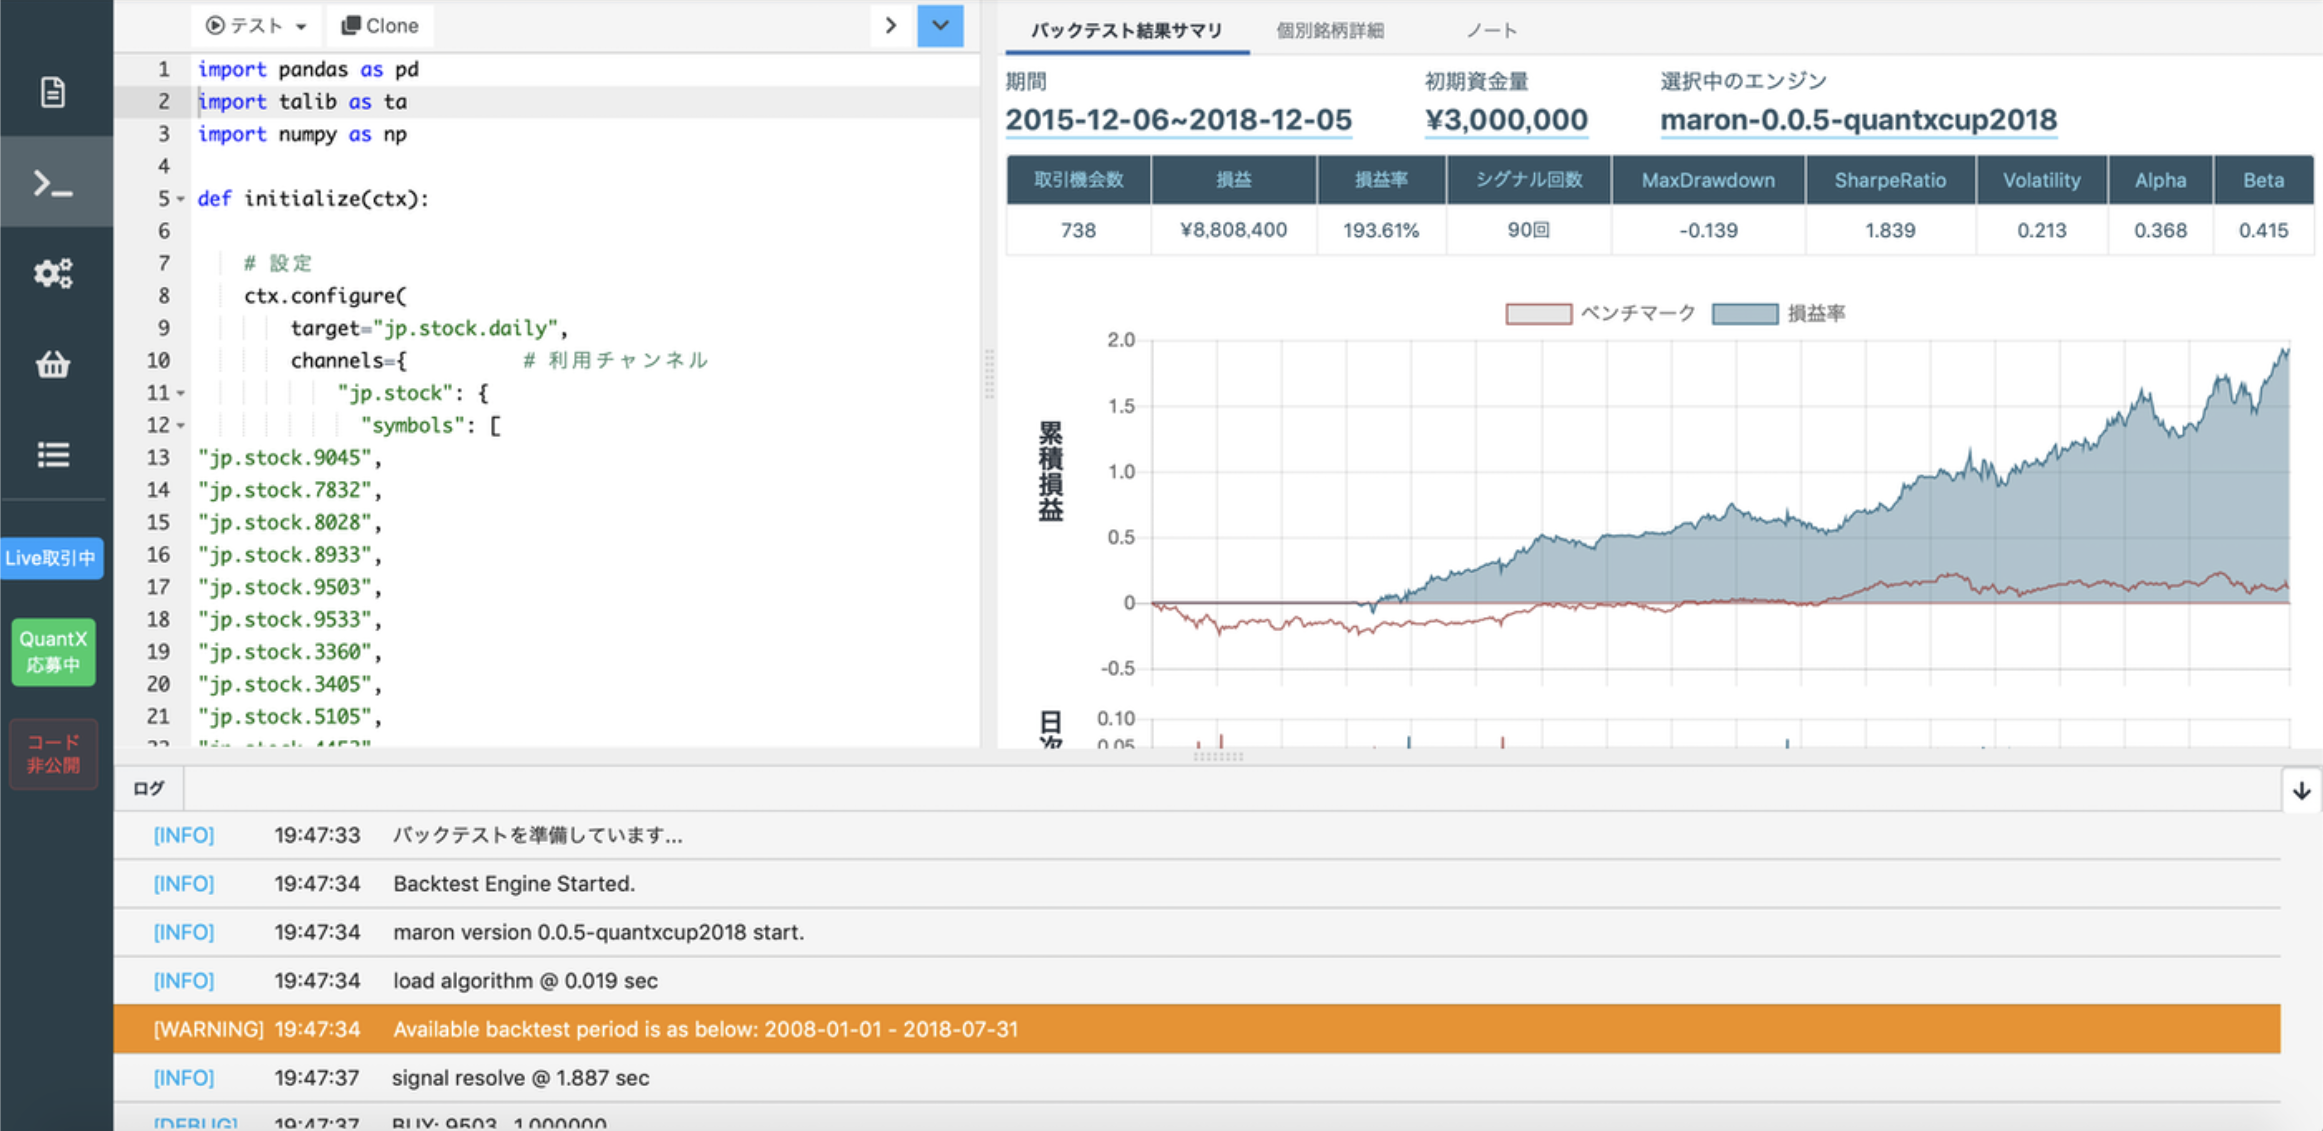
これが最終版ですね。バックテストをしてみます。
損益率が**193.61%に改善しました‼️ MaxDrowdownも-13.9%**に改善しました‼️‼️
採用銘柄とか、使う指標、シグナルを発する状況をいじると、成績を改善できるかもしれません。
最後に
皆さんも、ぜひQuantXでアルゴリズム作って試してみてください‼️‼️‼️‼️
無料で作れますよーーーー‼️‼️
QuantX Factoryホームページ
免責注意事項
このコード・知識を使った実際の取引で生じた損益に関しては一切の責任を負いかねますので御了承下さい。また、内容には注意を払っていますが、その正確性を一切保証いたしませんので御了承ください。

